About Me
I'm Director of Teaching and Learning at CUNY's Newmark Graduate School of Journalism in New York City. I teach classes, workshops and now webinars on entrepreneurial and digital journalism. I love learning new ways to learn, teach, or create new things. And I love finding new ways to help teachers and journalists. Wonder is what drives me. I share what I love by teaching and writing.
I grew up in Boston with a violin in one hand and a catcher's mitt on the other. I was an admirer of both Heifetz and the Chicago Cubs. During my time at Princeton I served during the winter as concertmaster for the International Symphony Orchestra in Jerusalem. I moved to New York to work for The Paris Review, Yahoo! Internet Life, and then Newsweek.
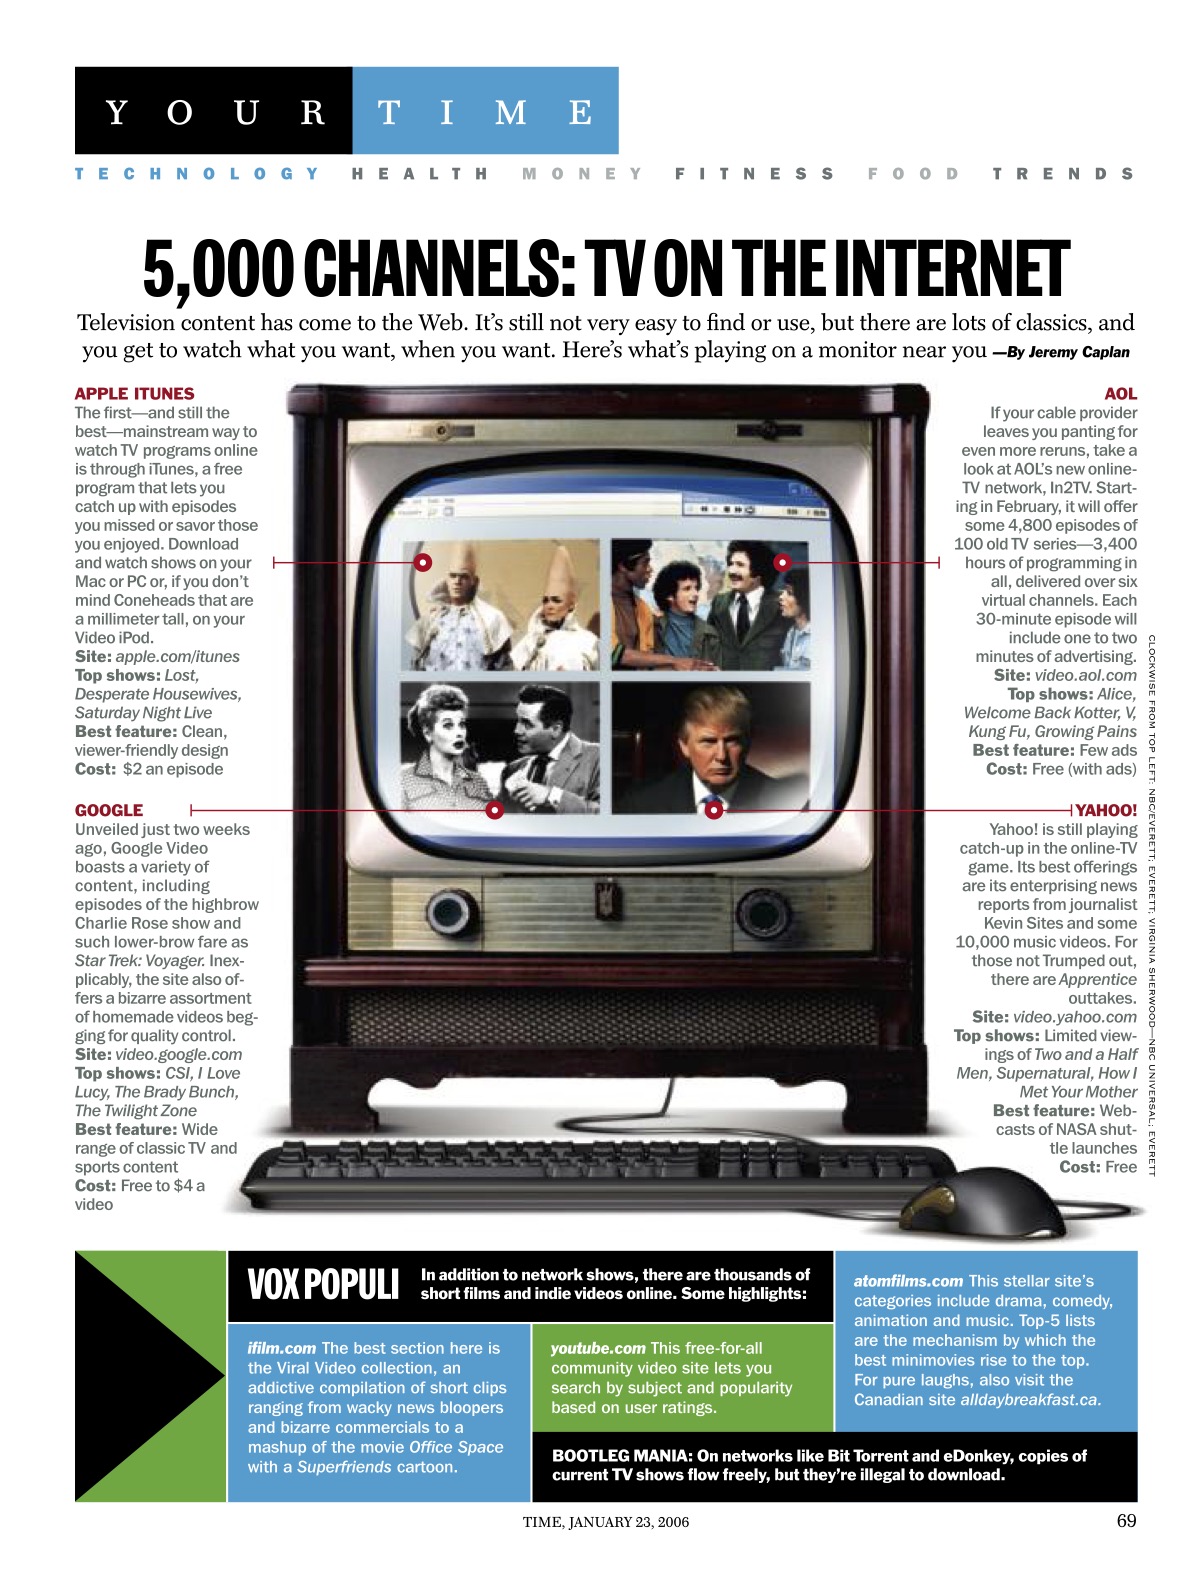
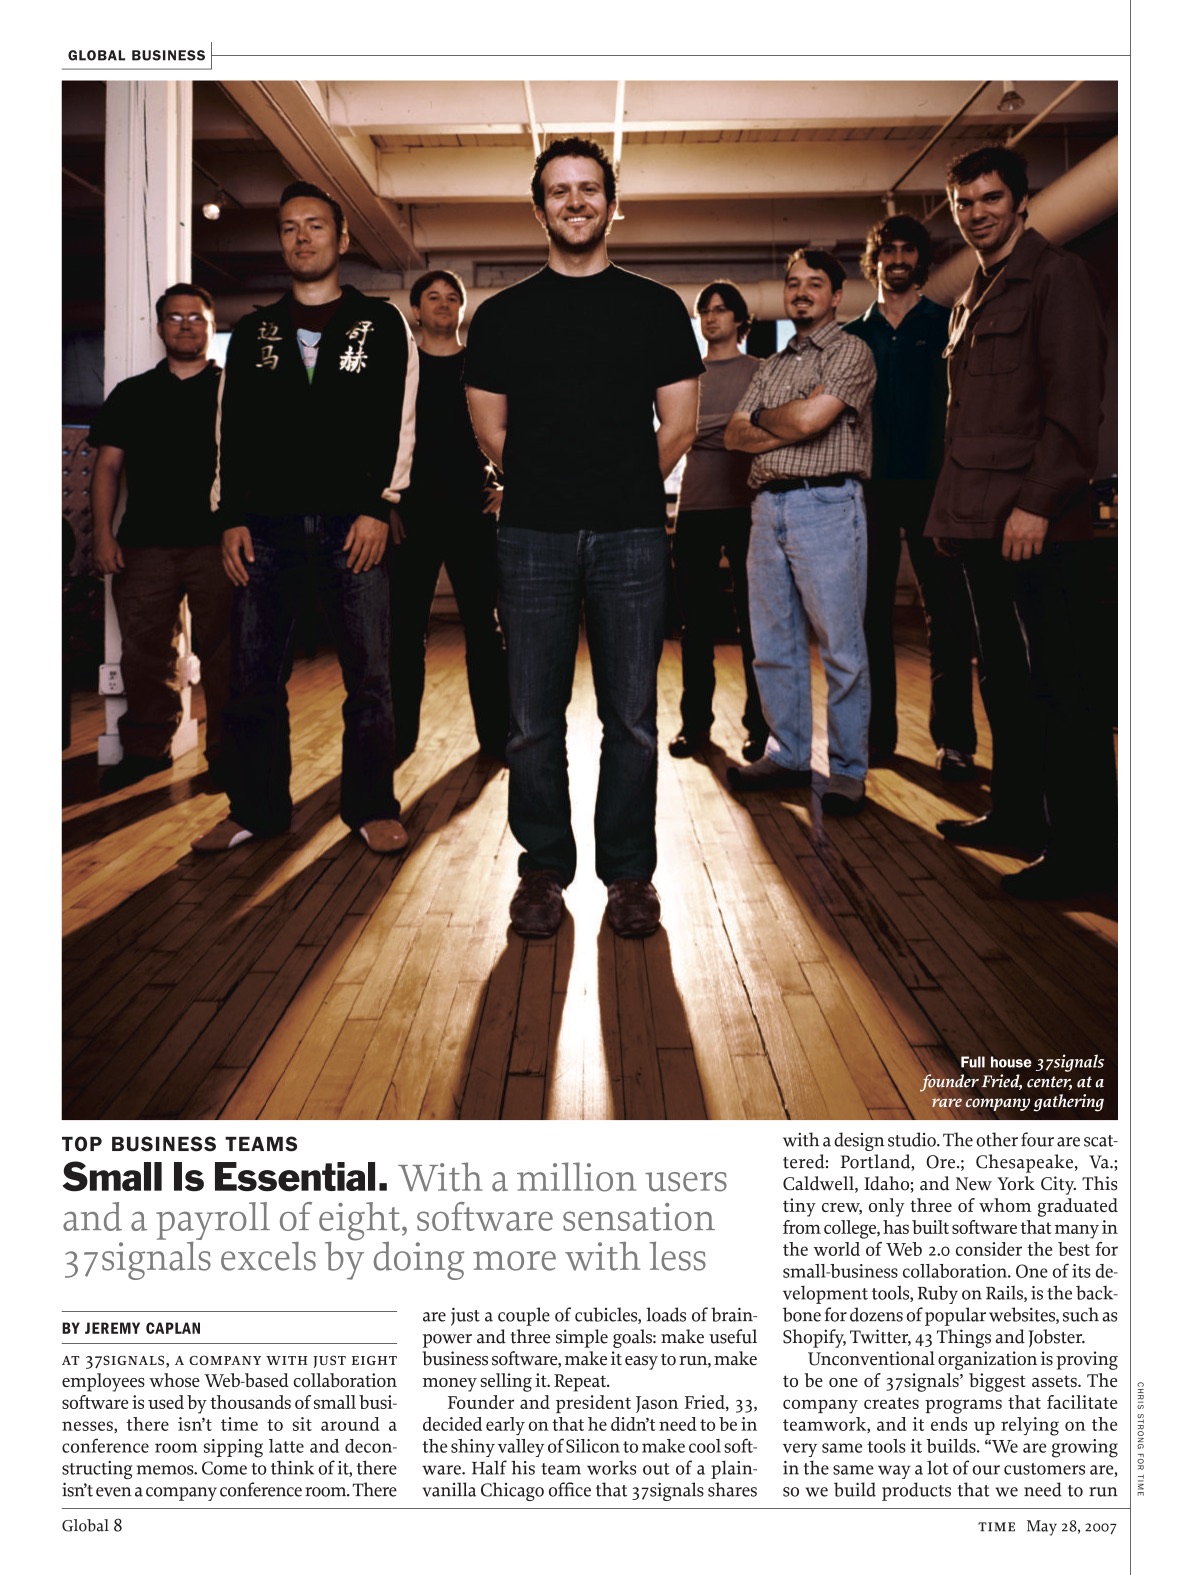
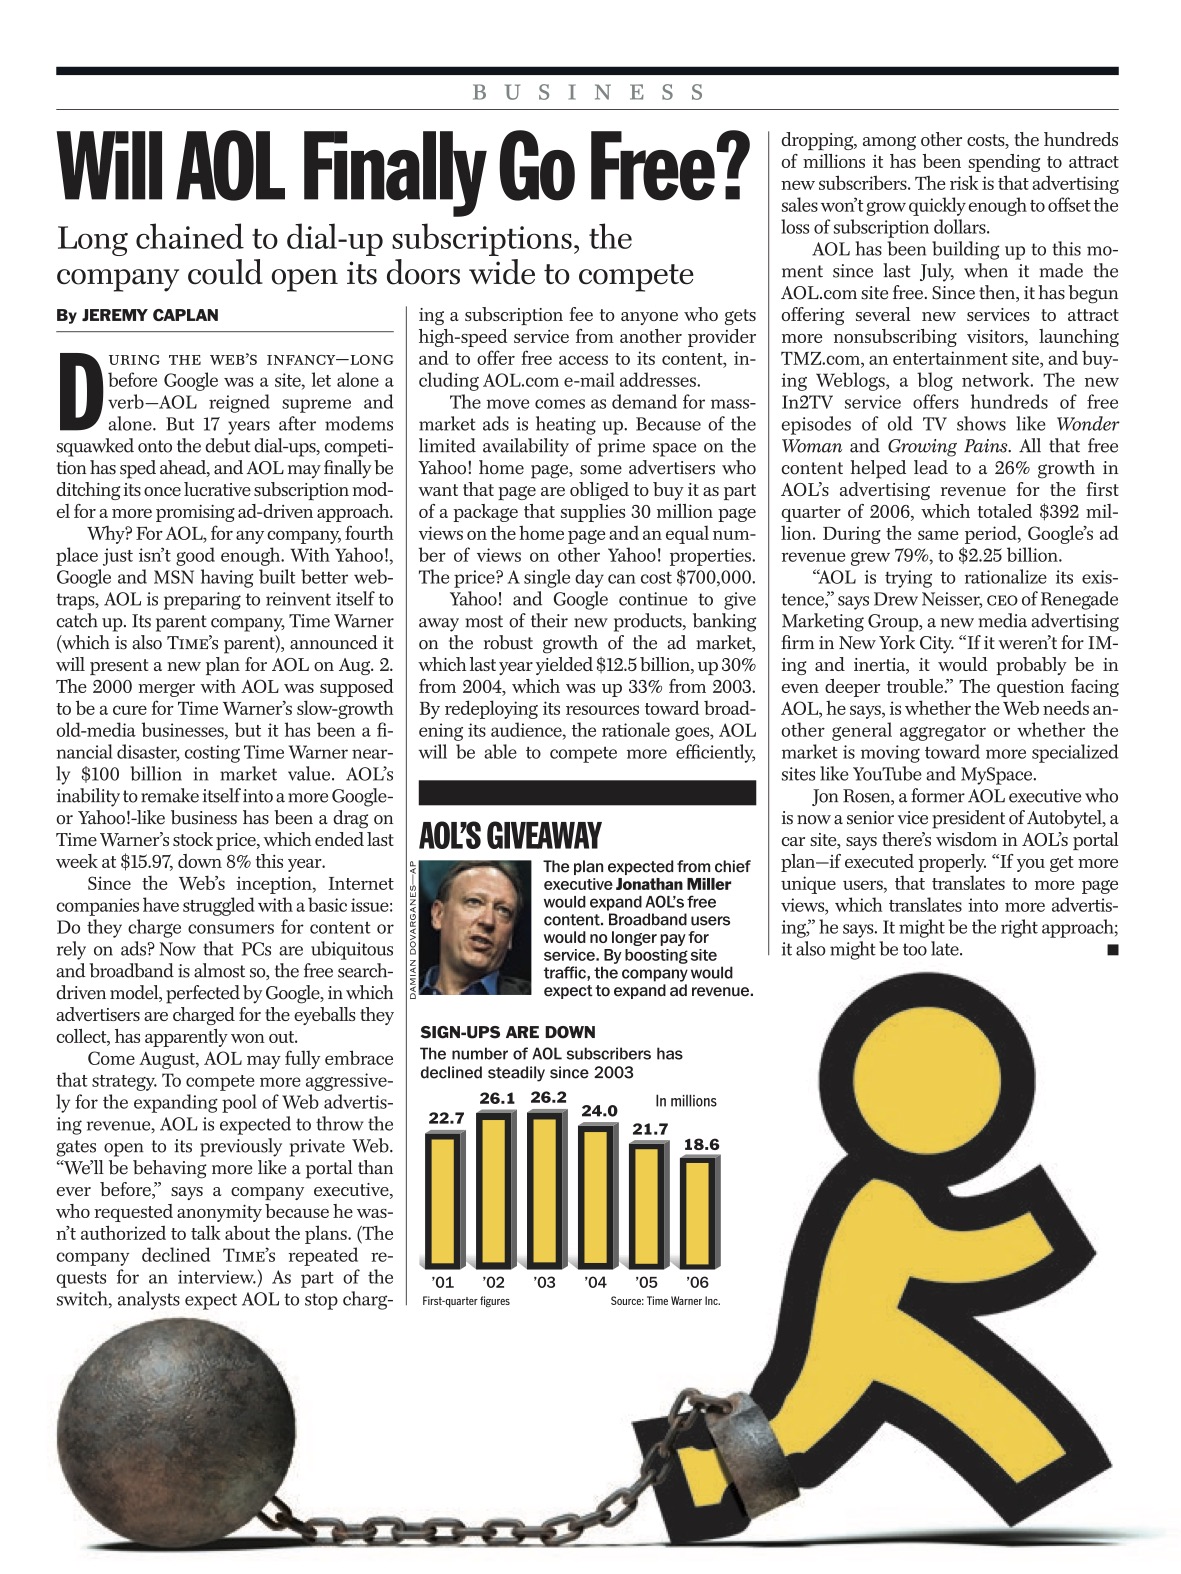
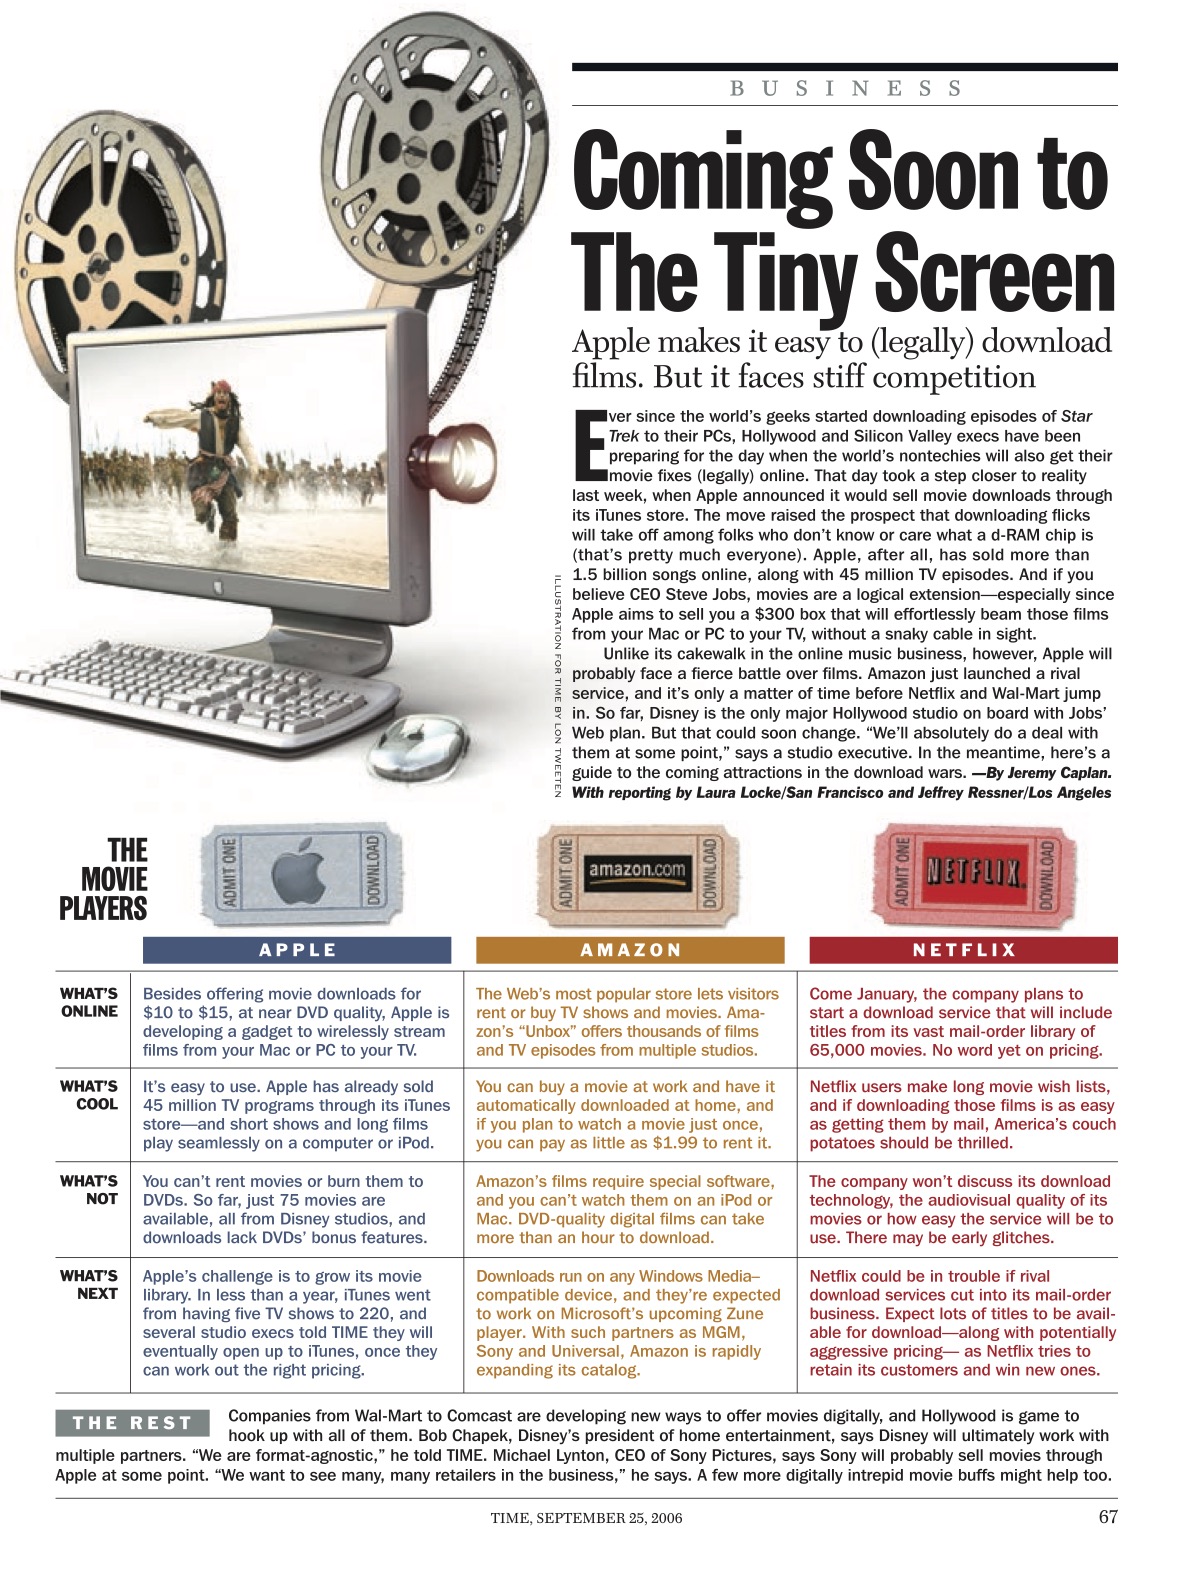
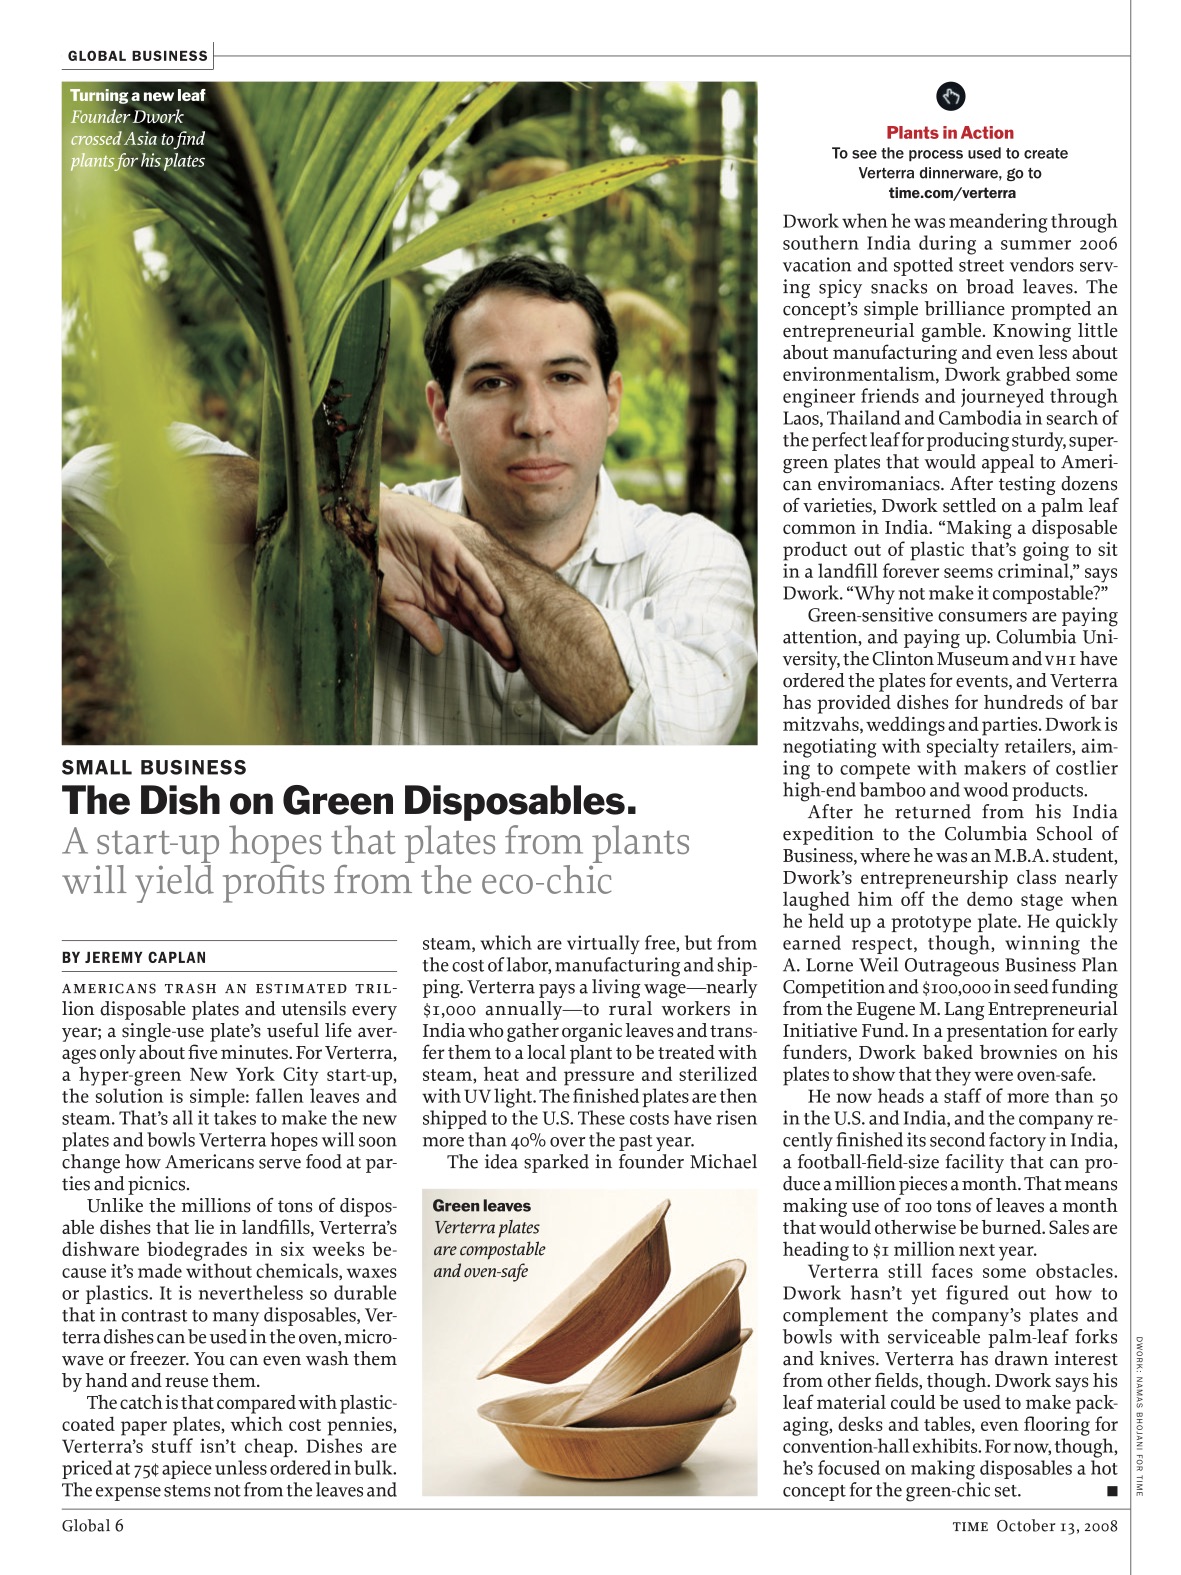
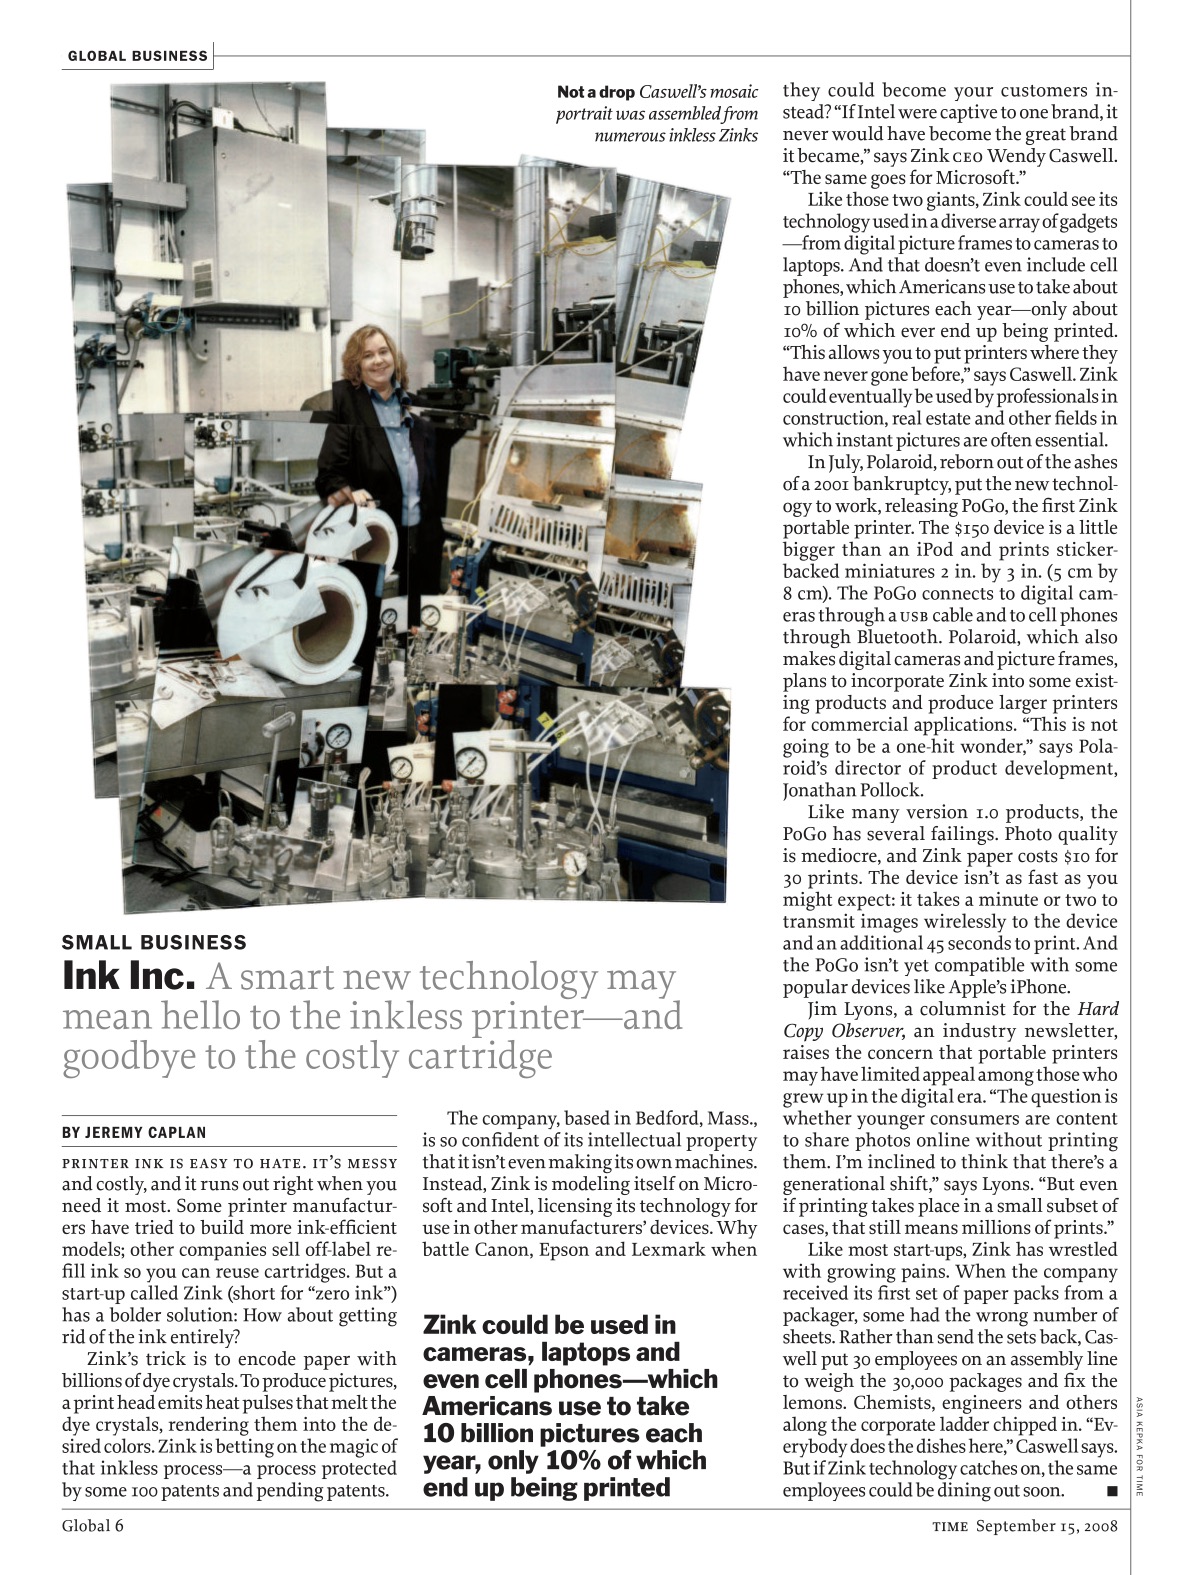
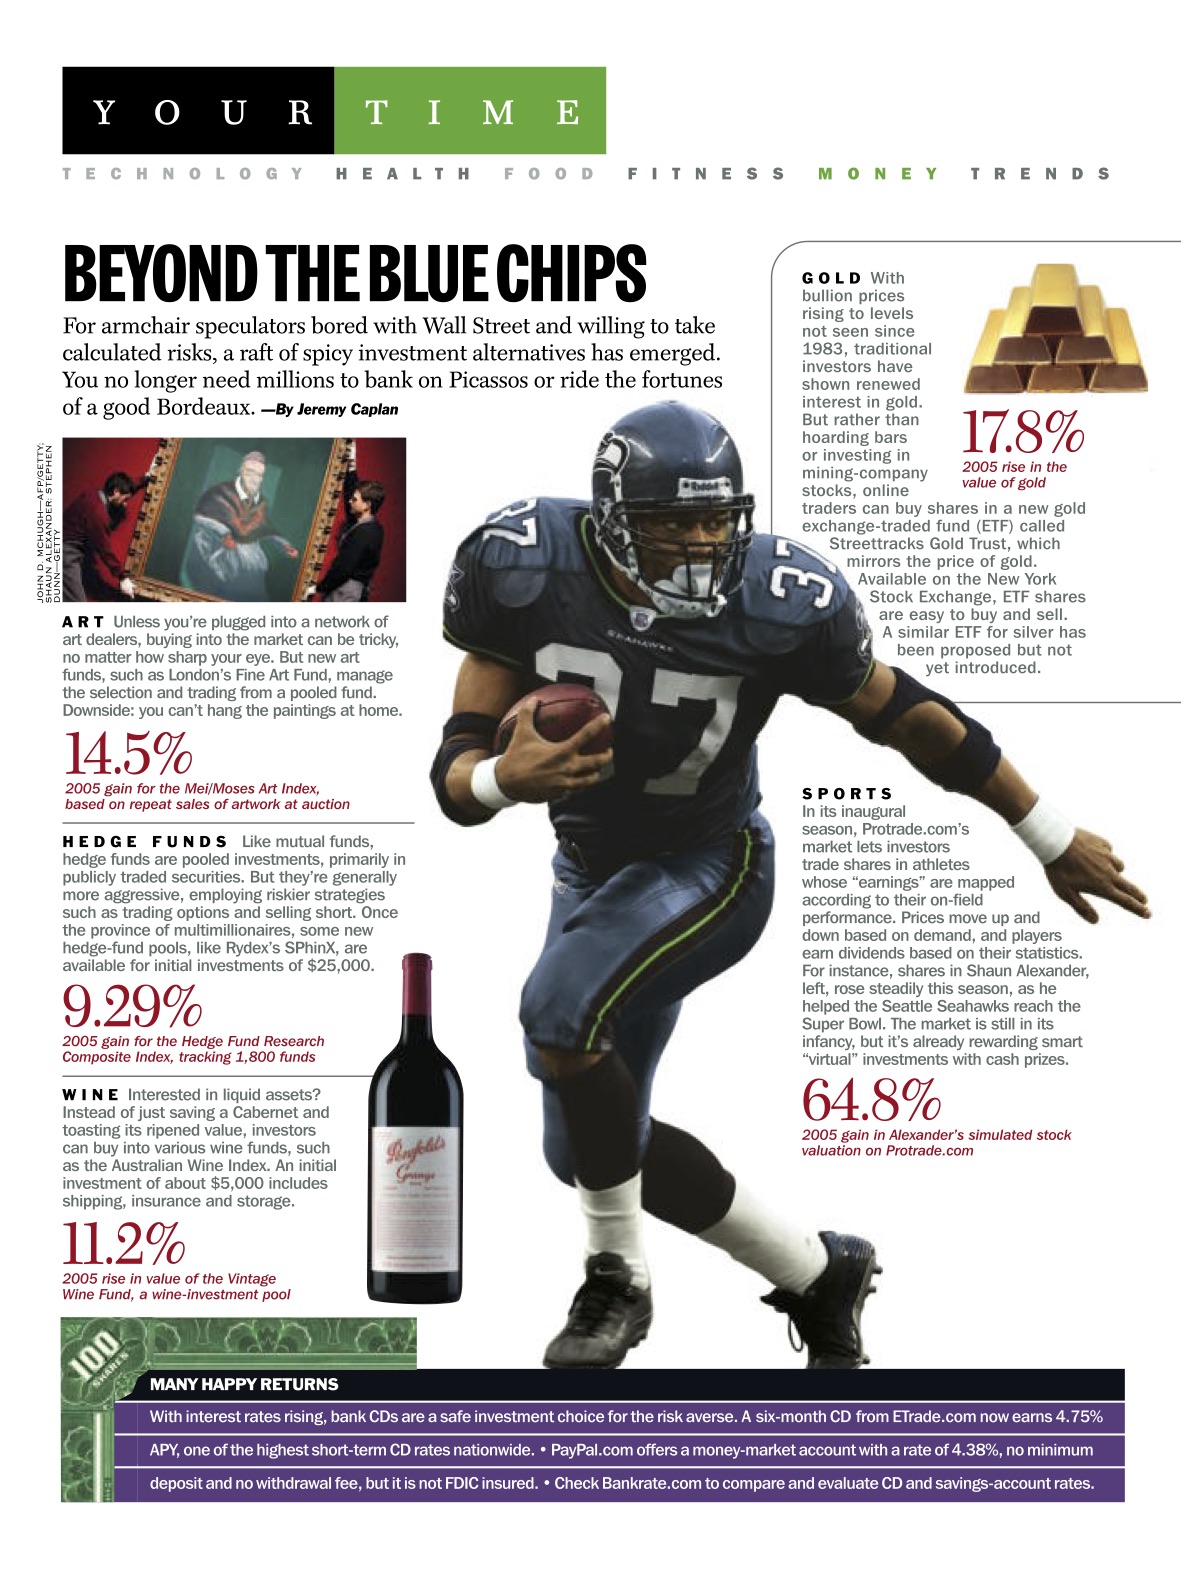
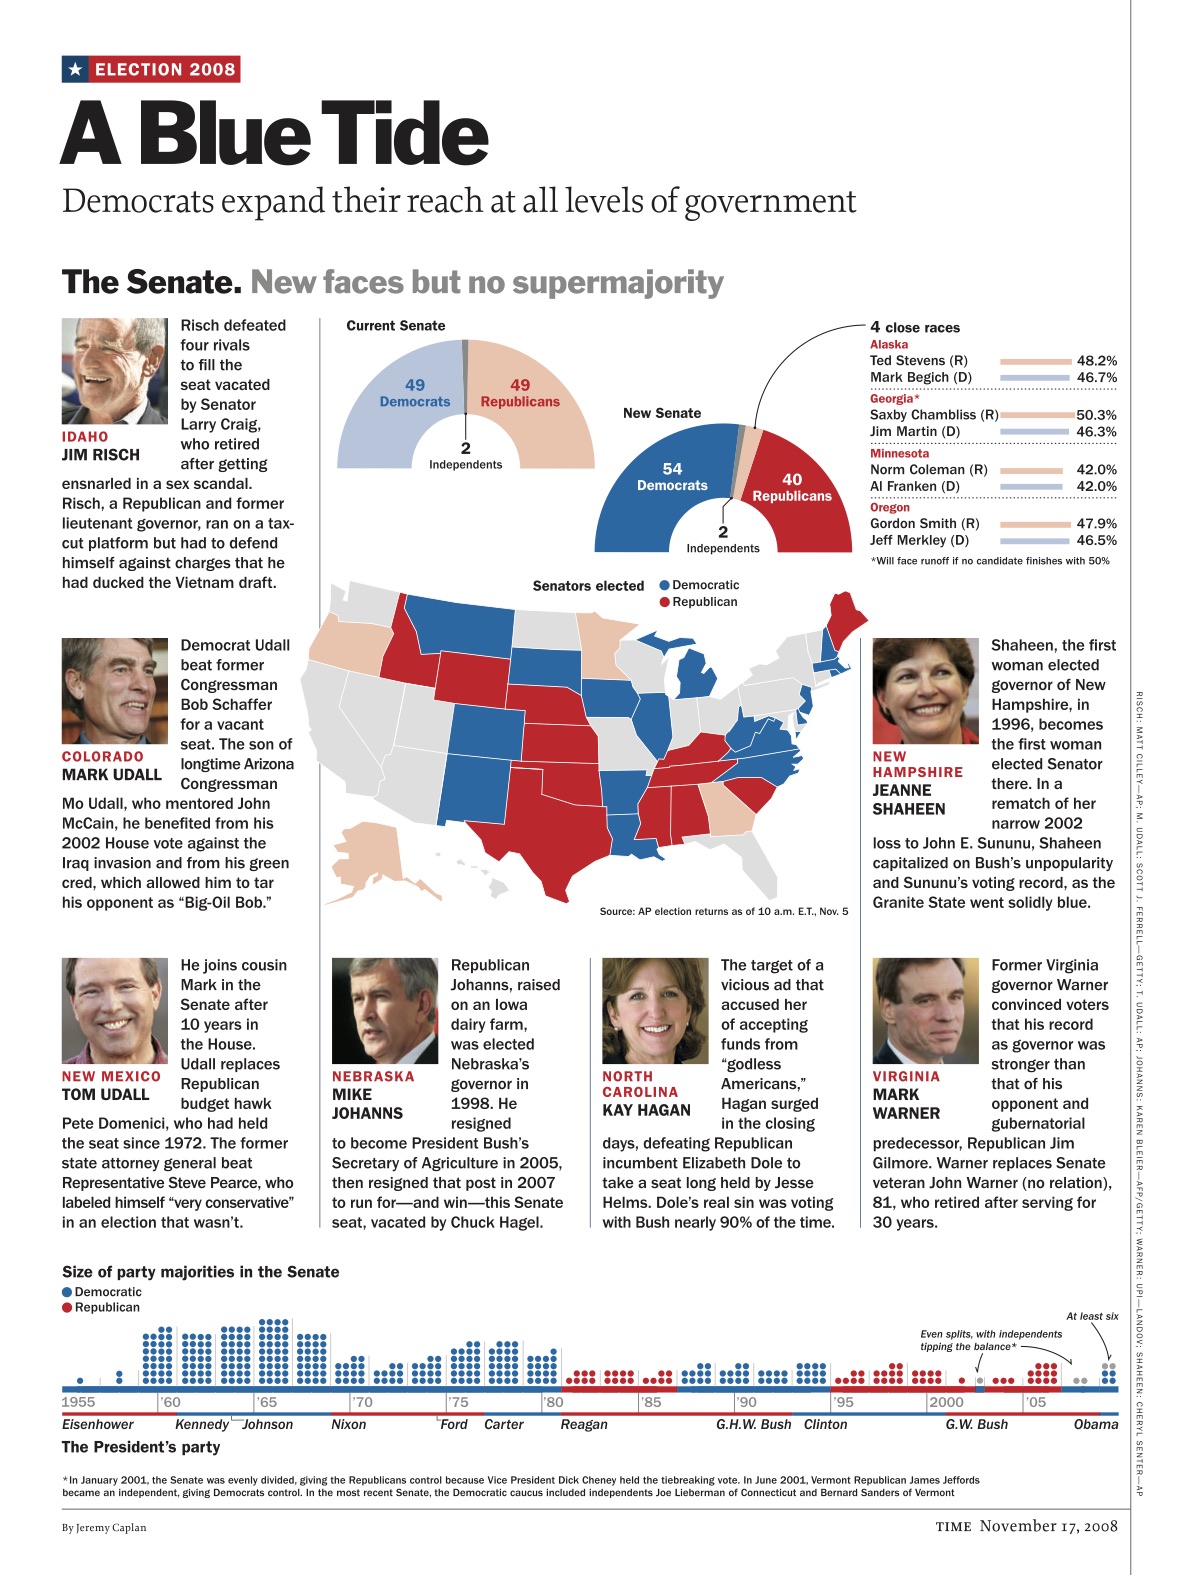
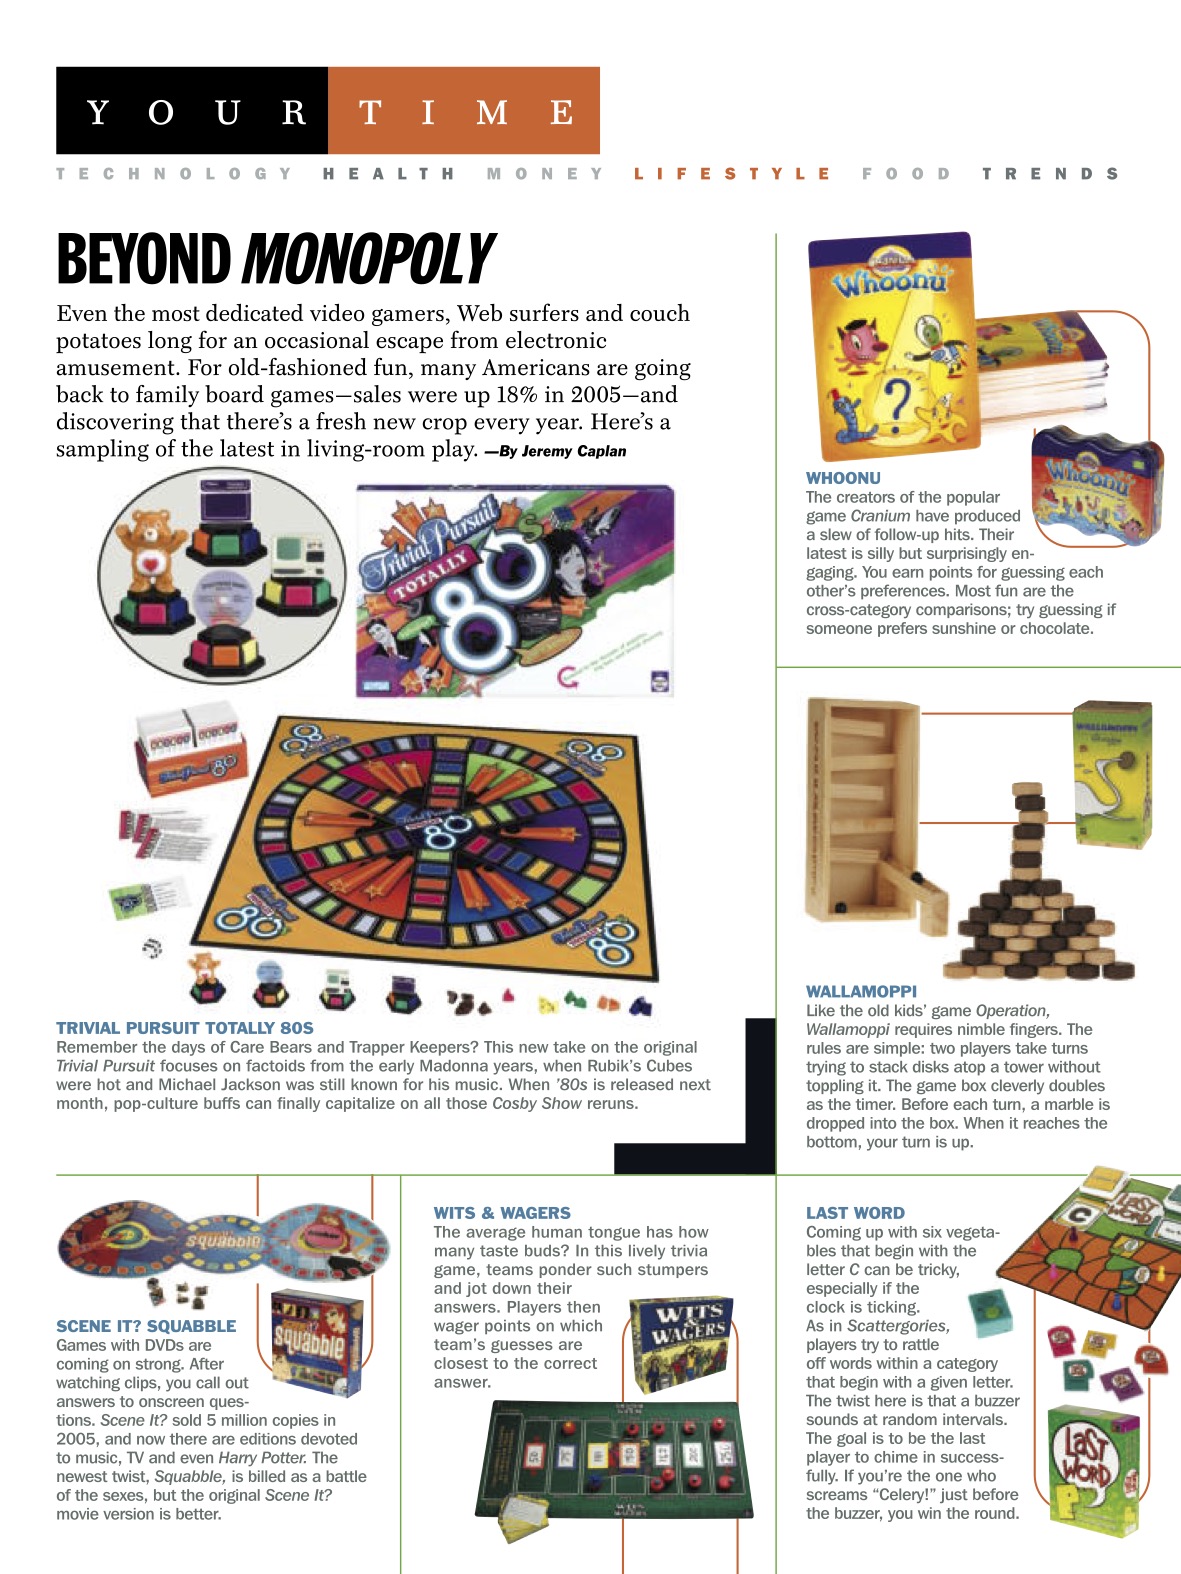
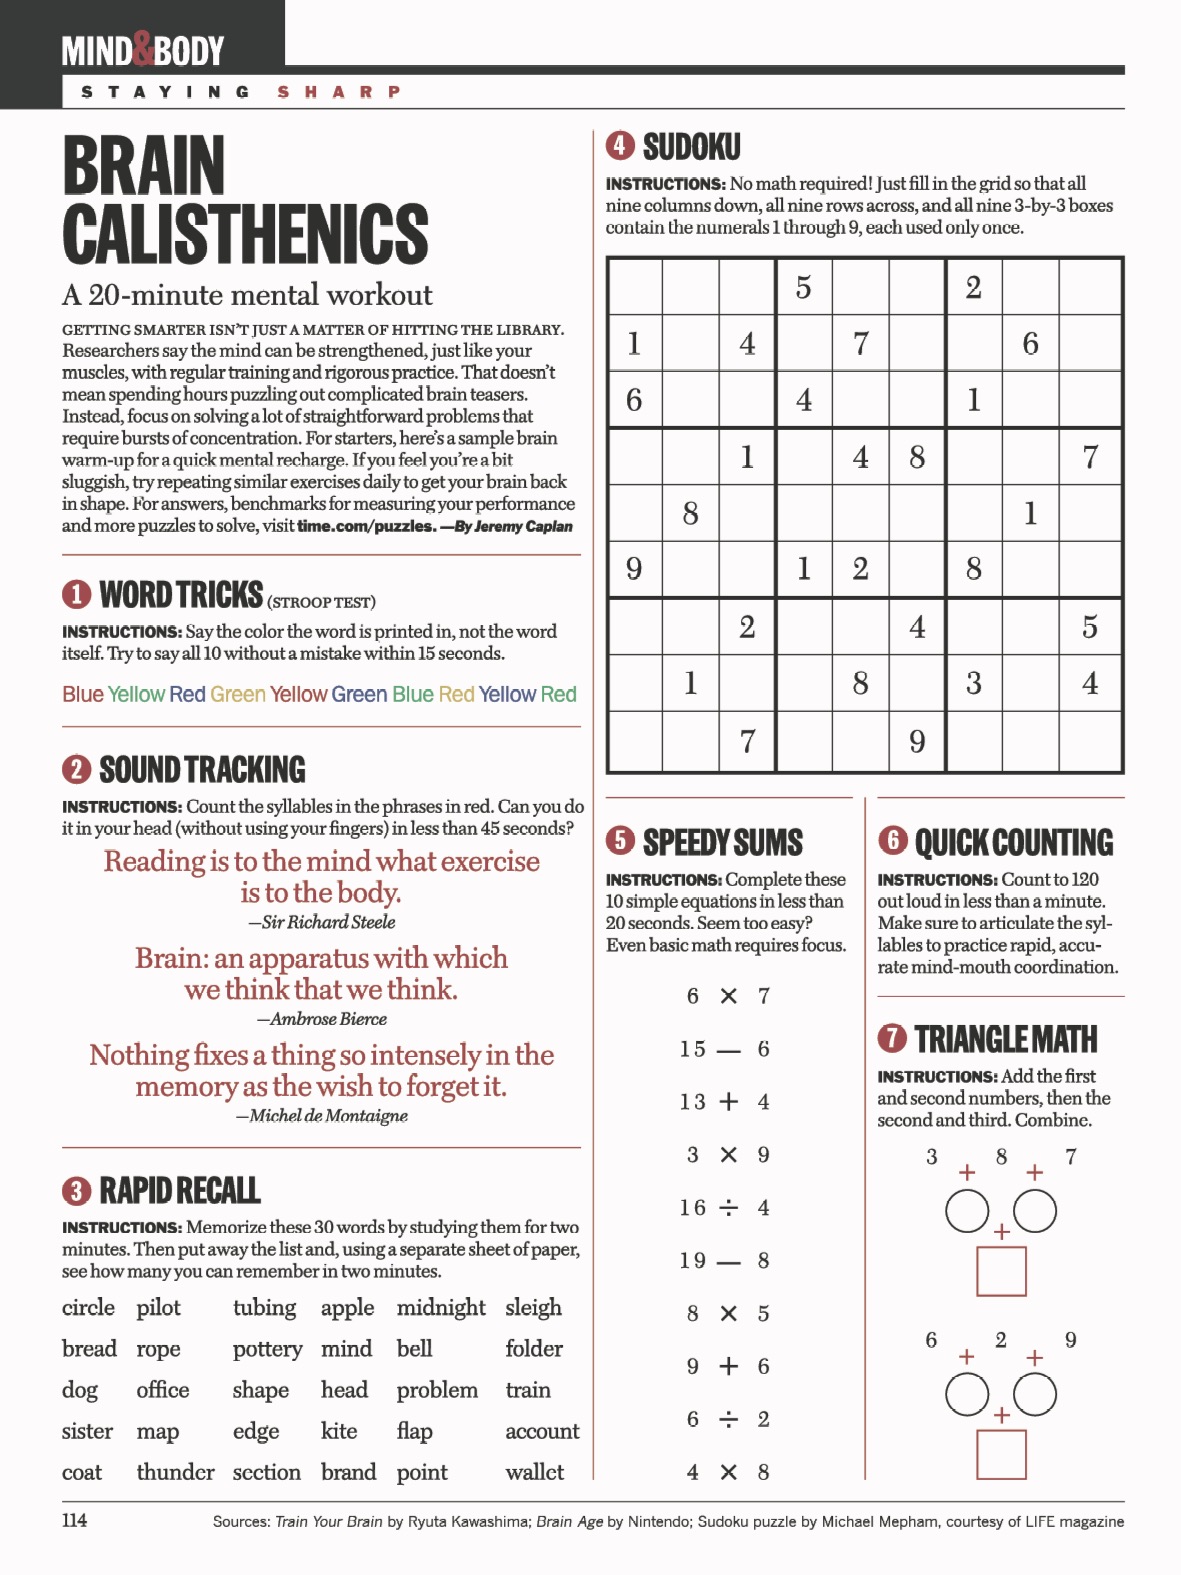
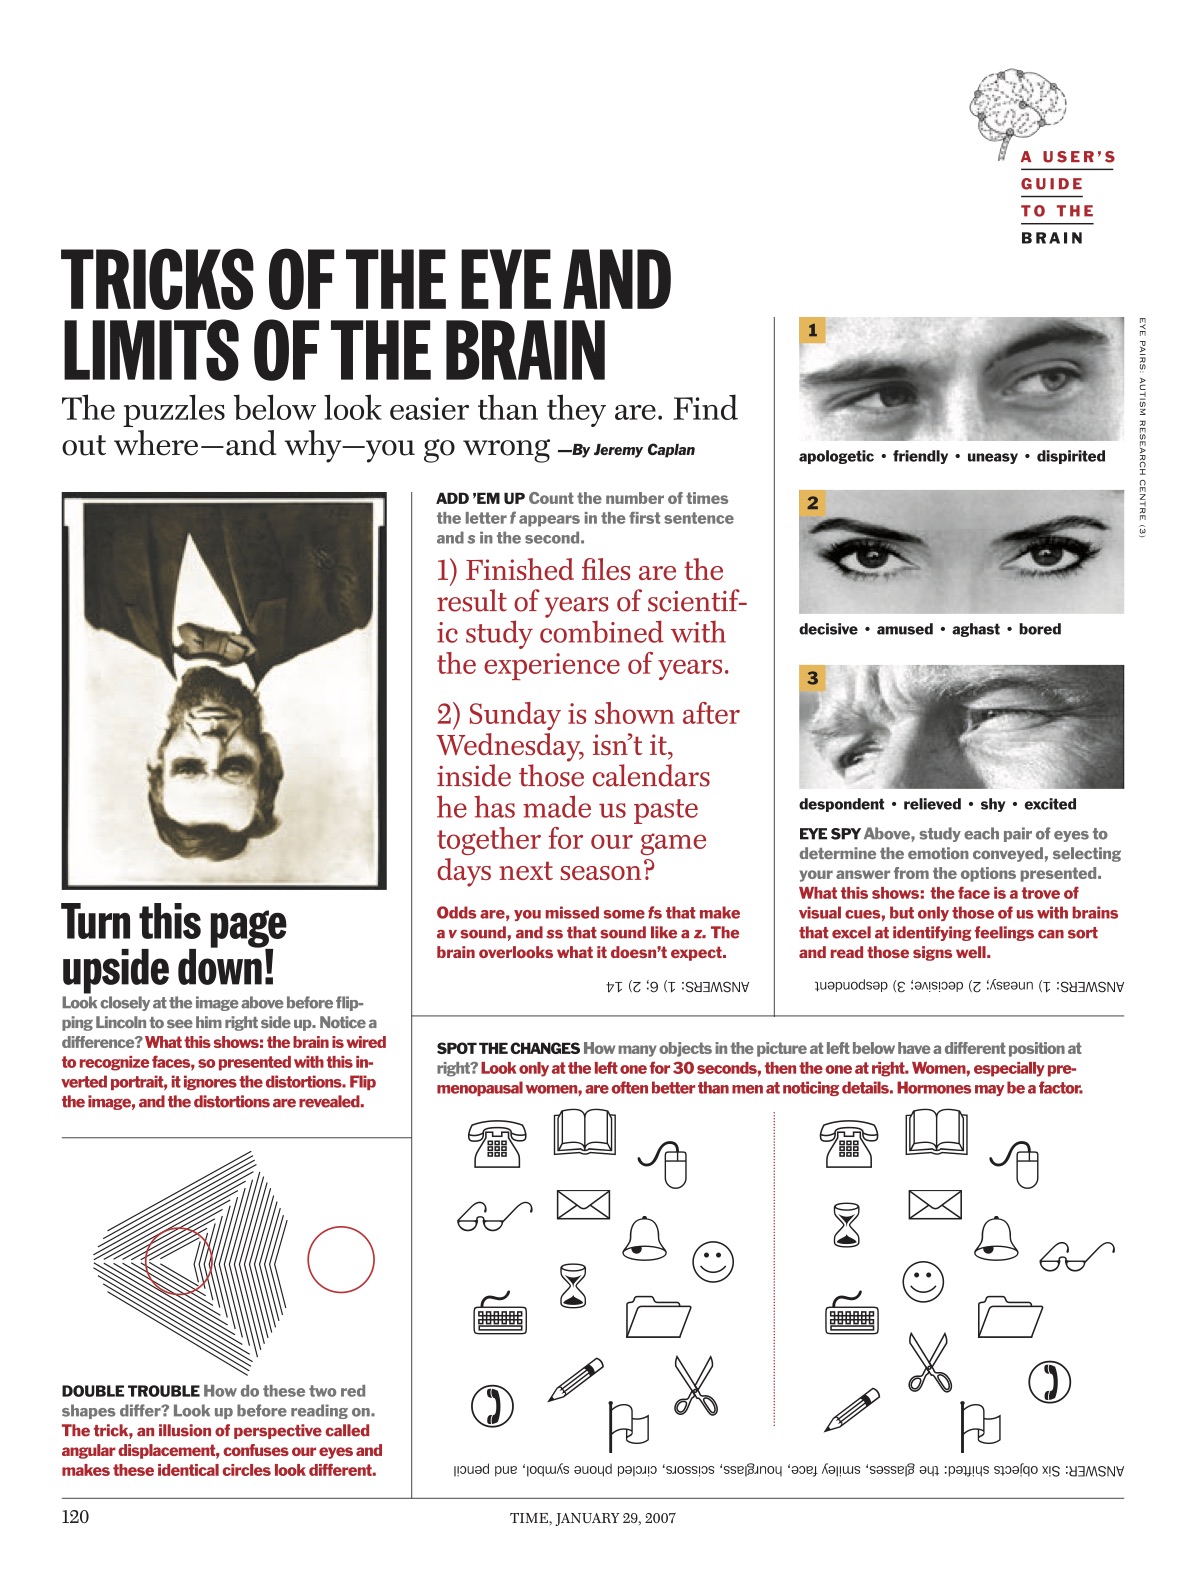
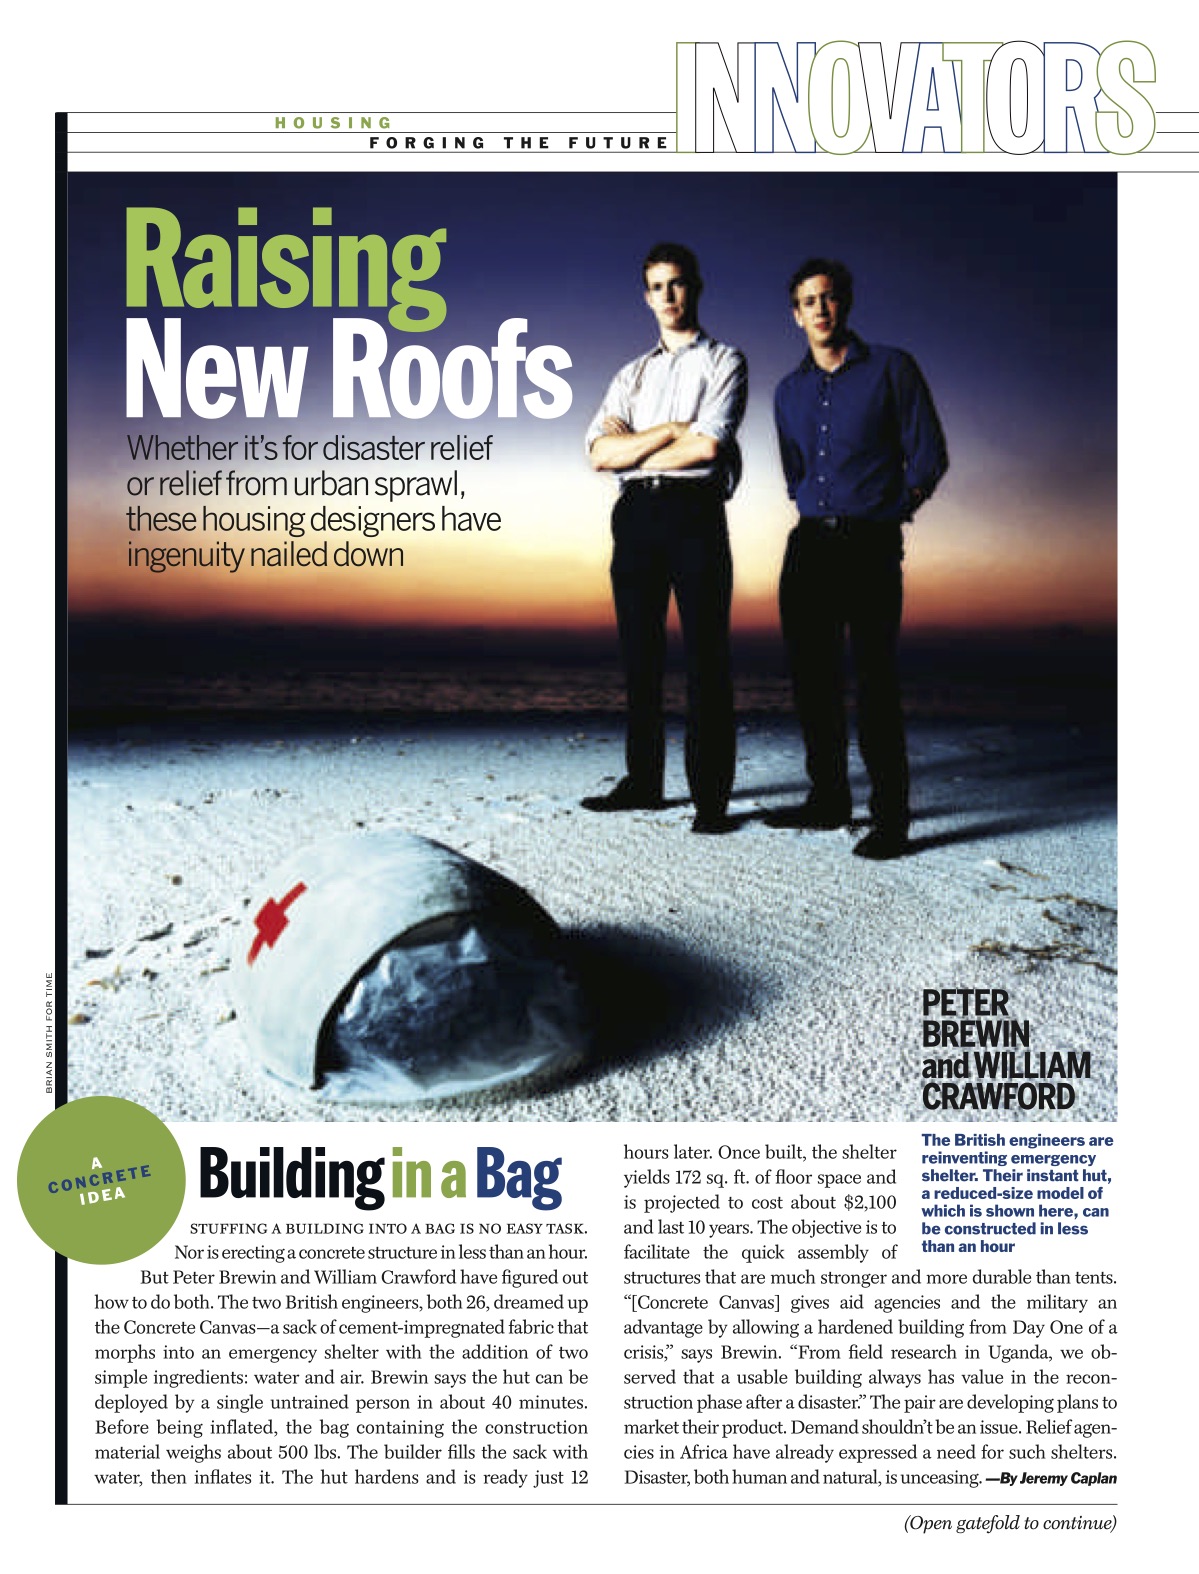
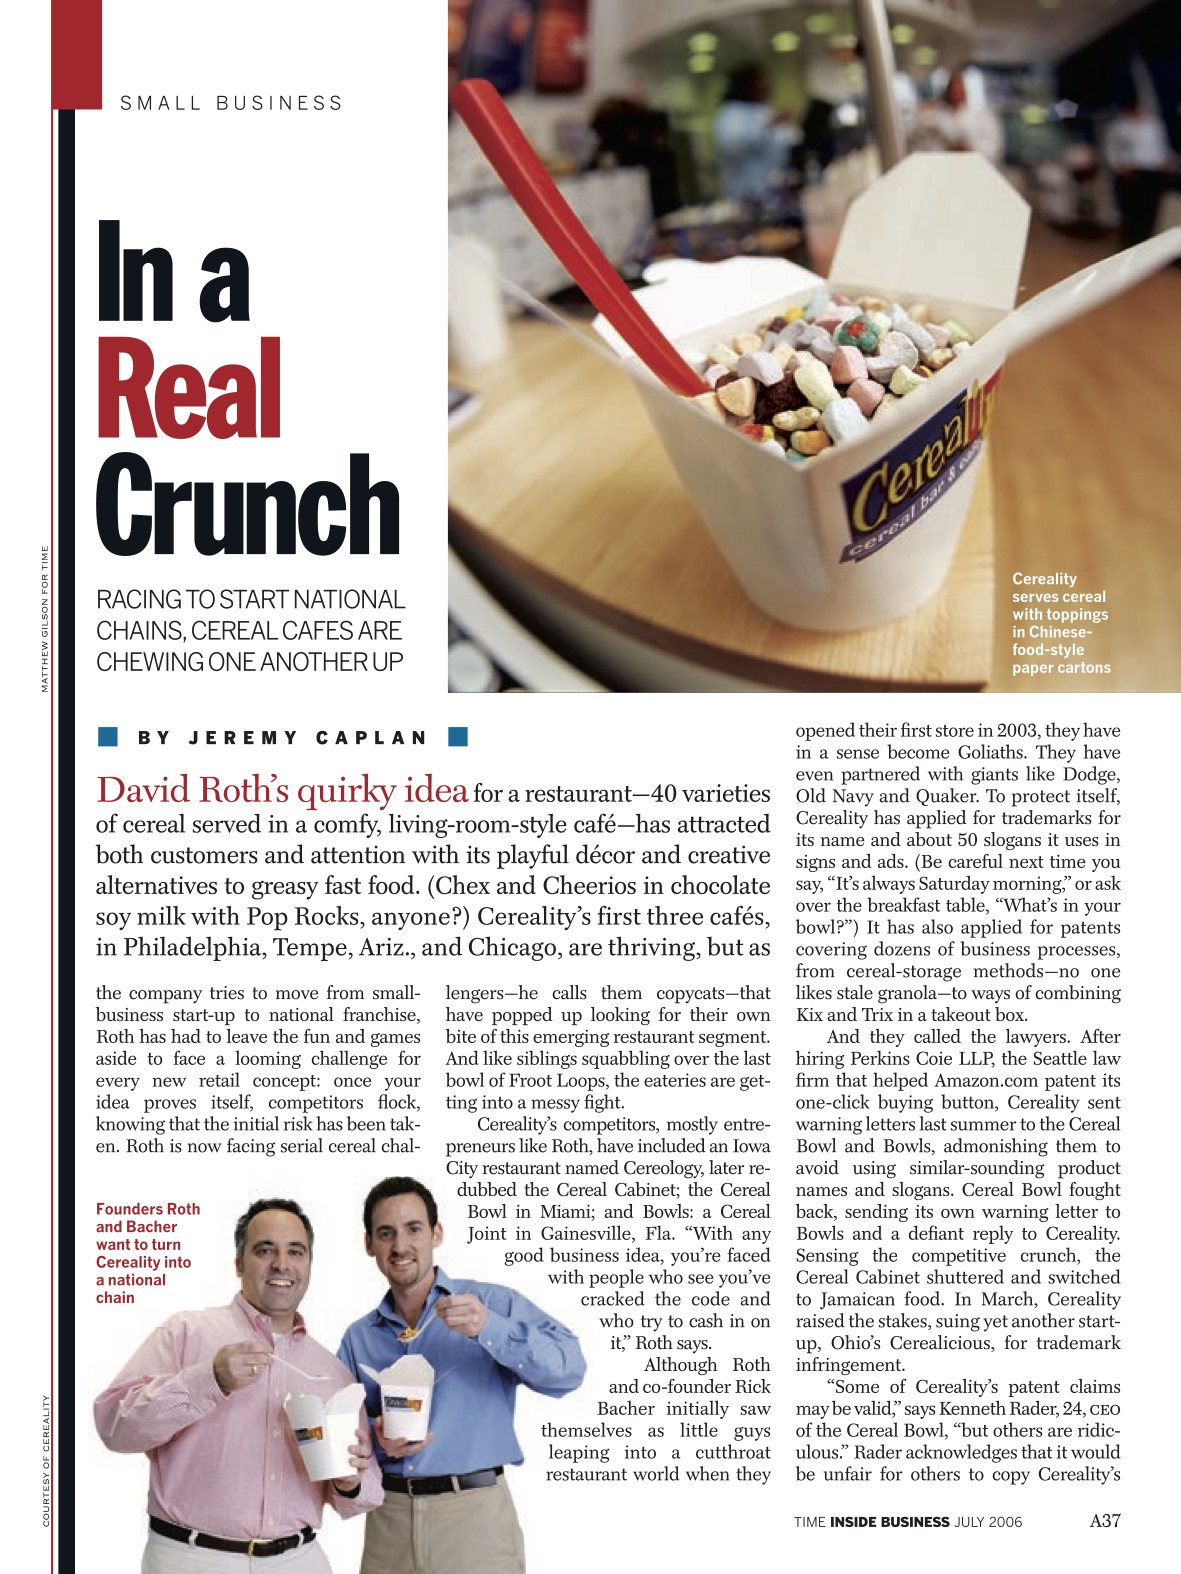
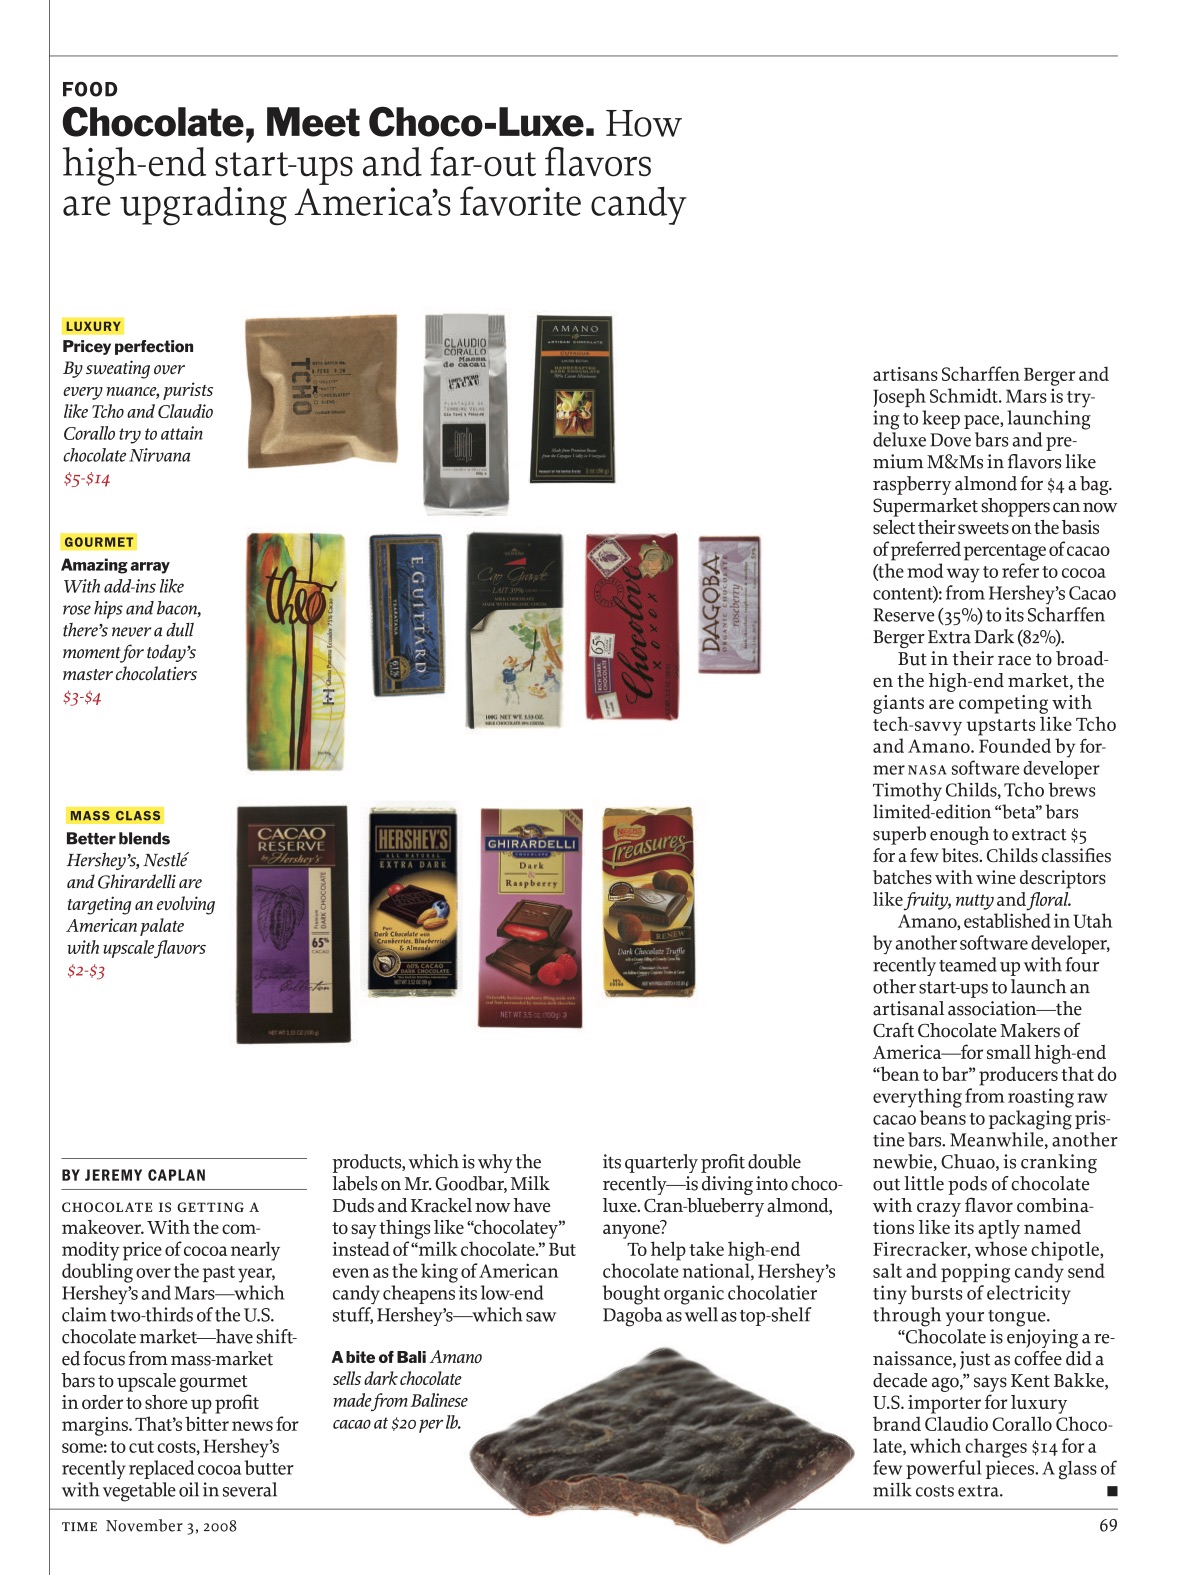
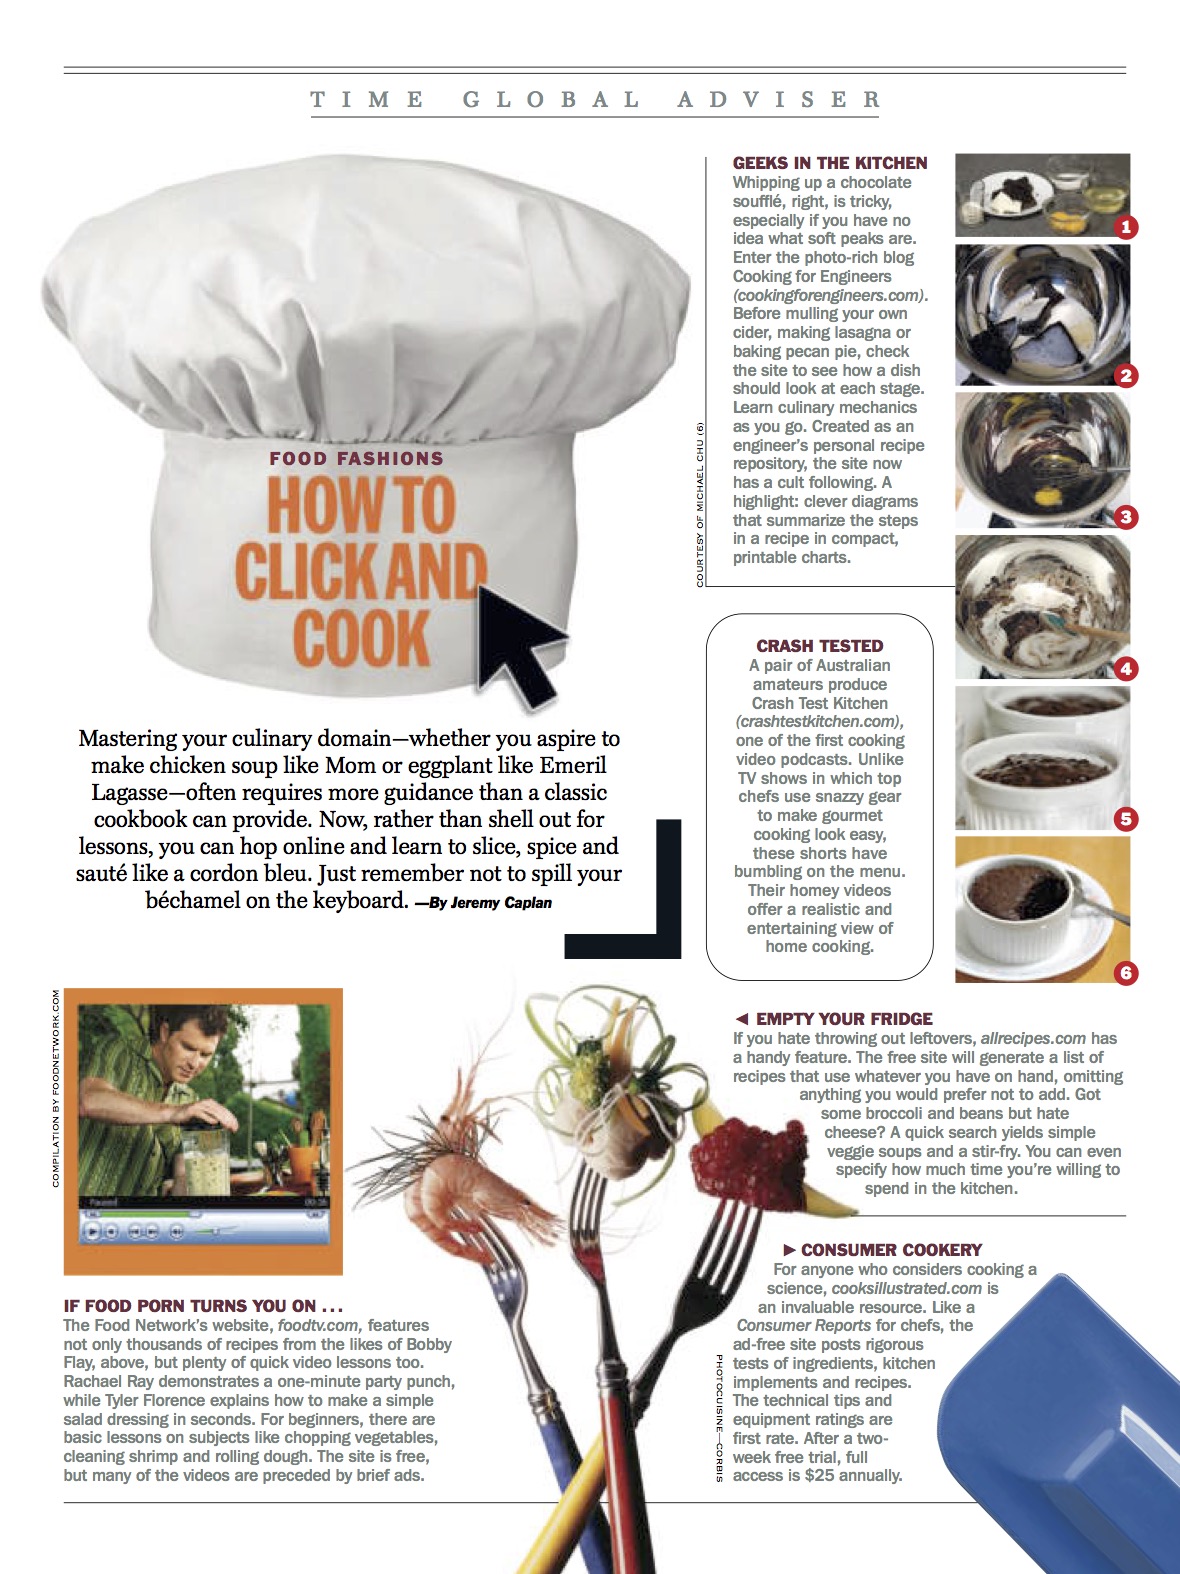
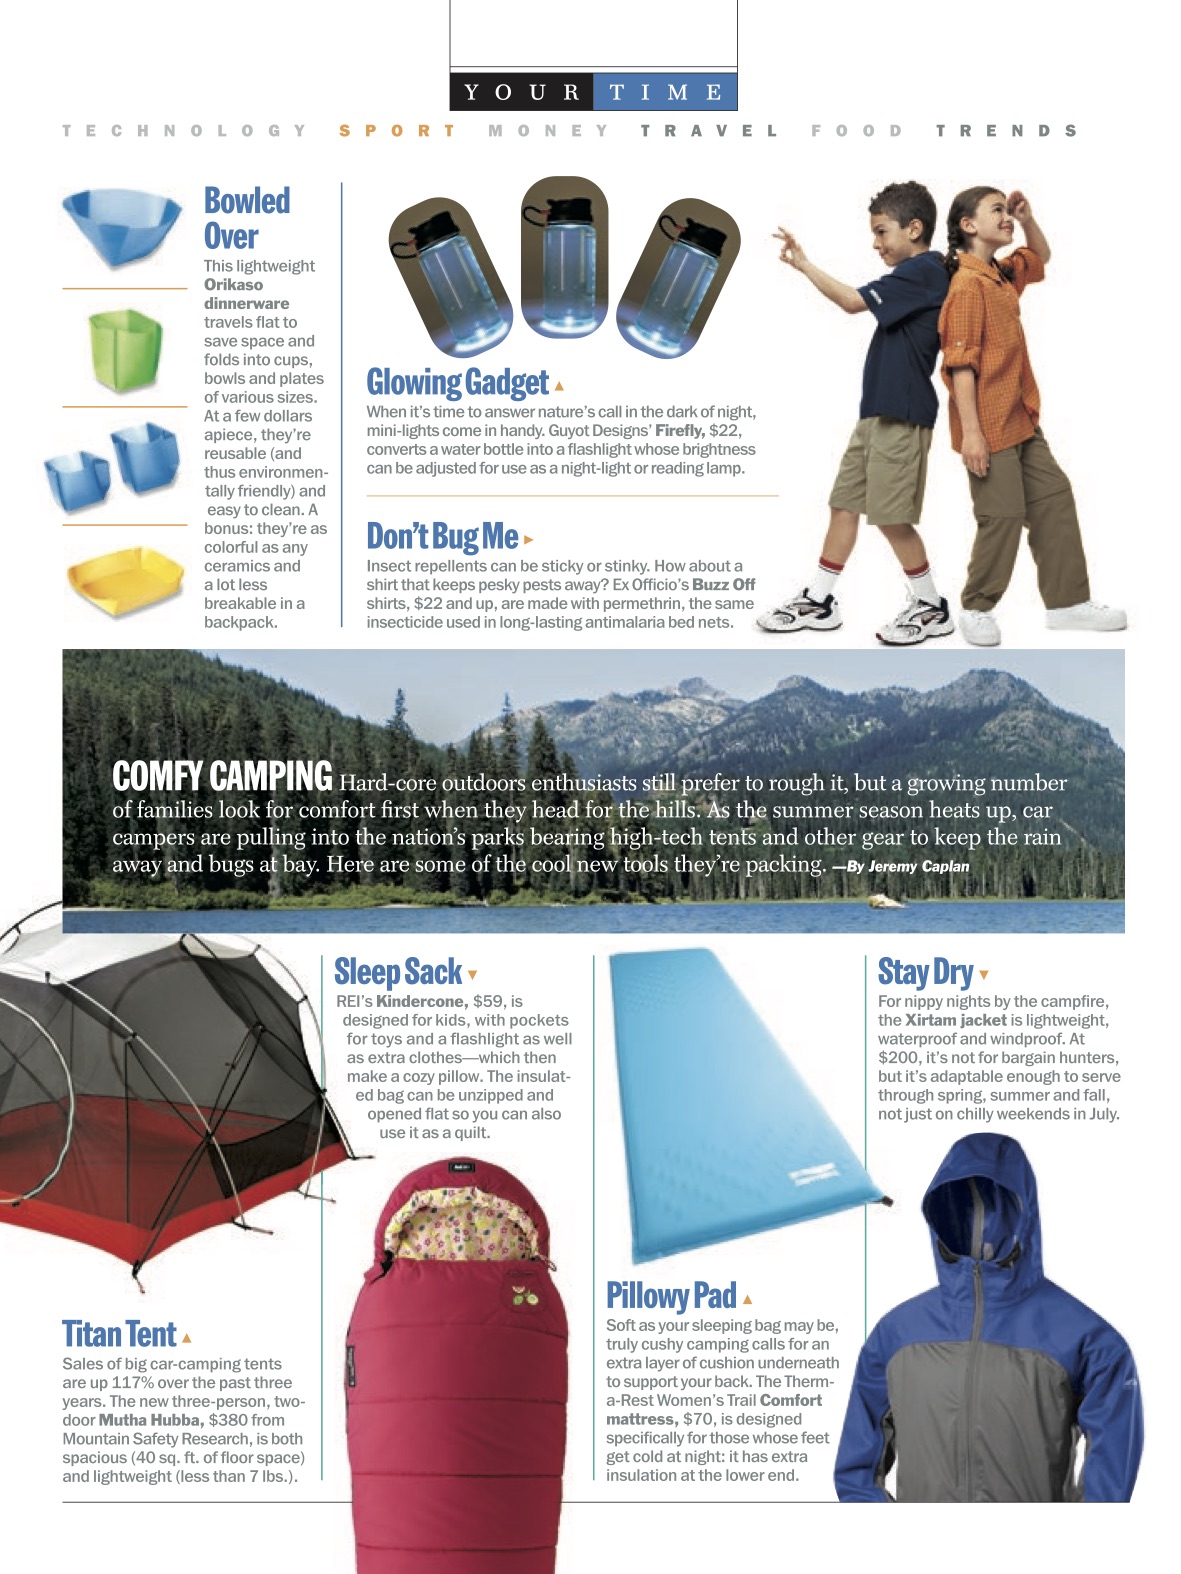
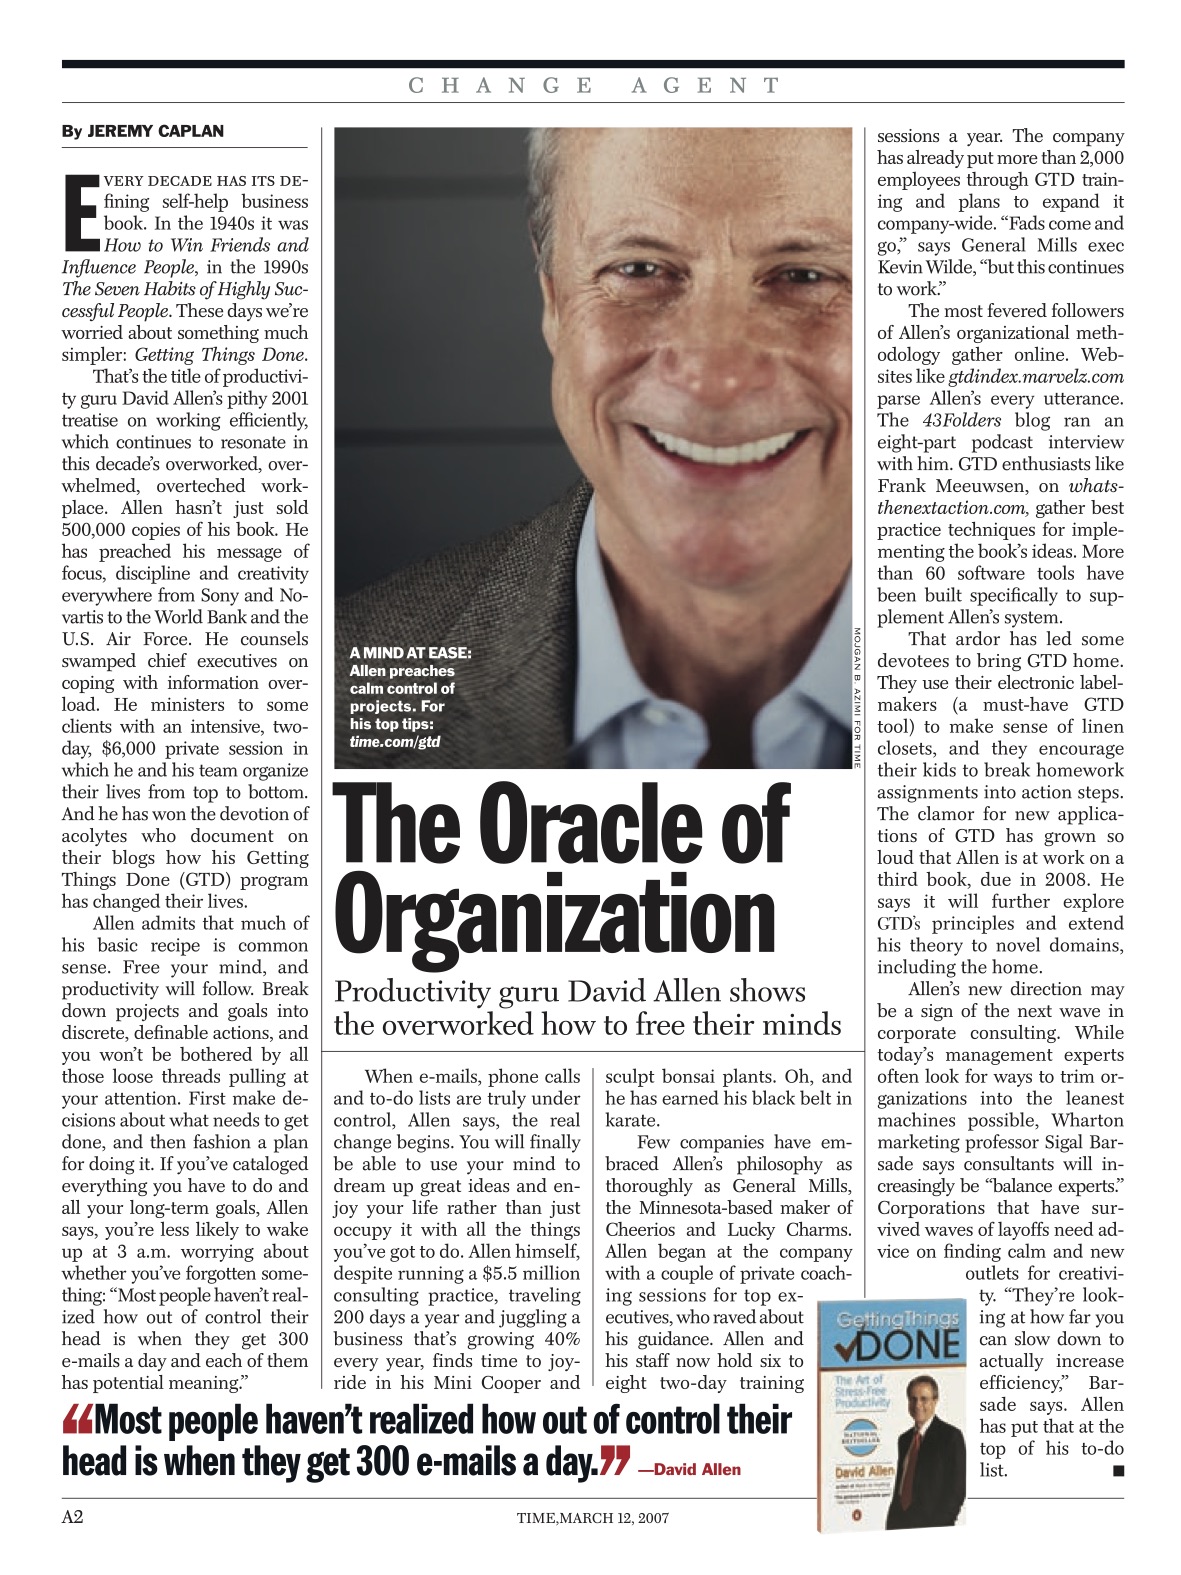
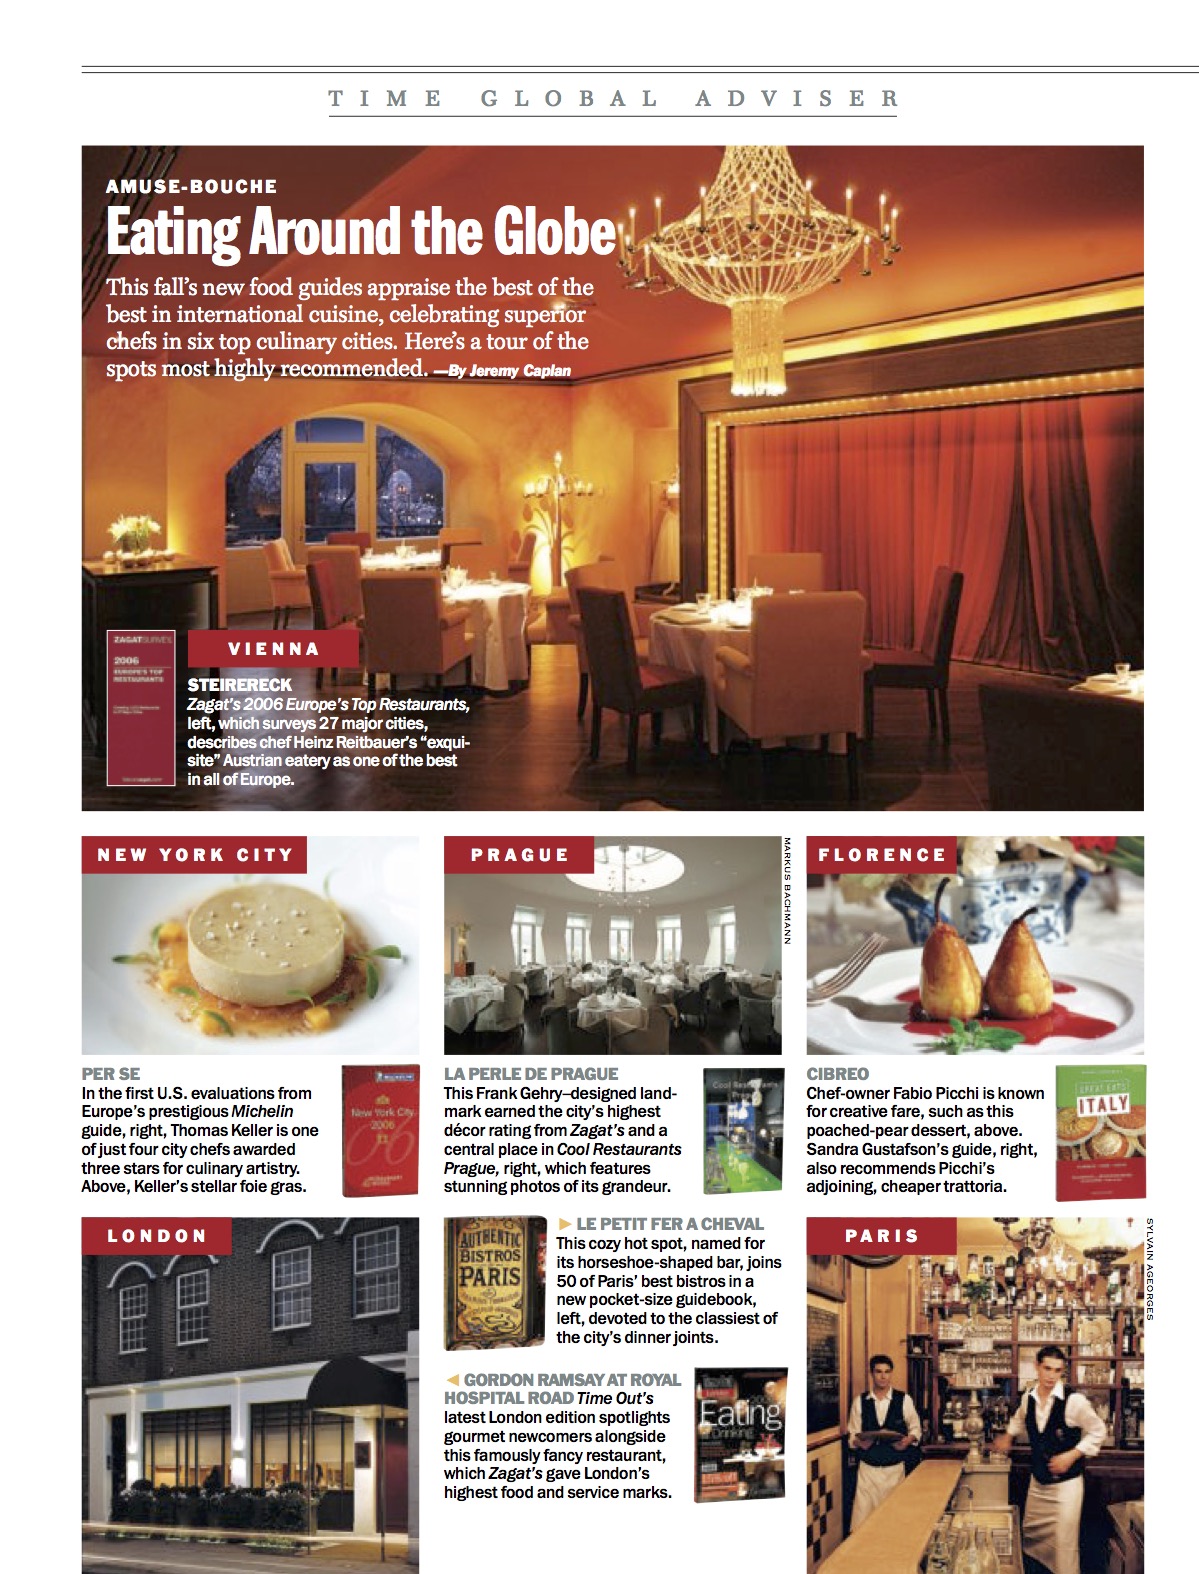
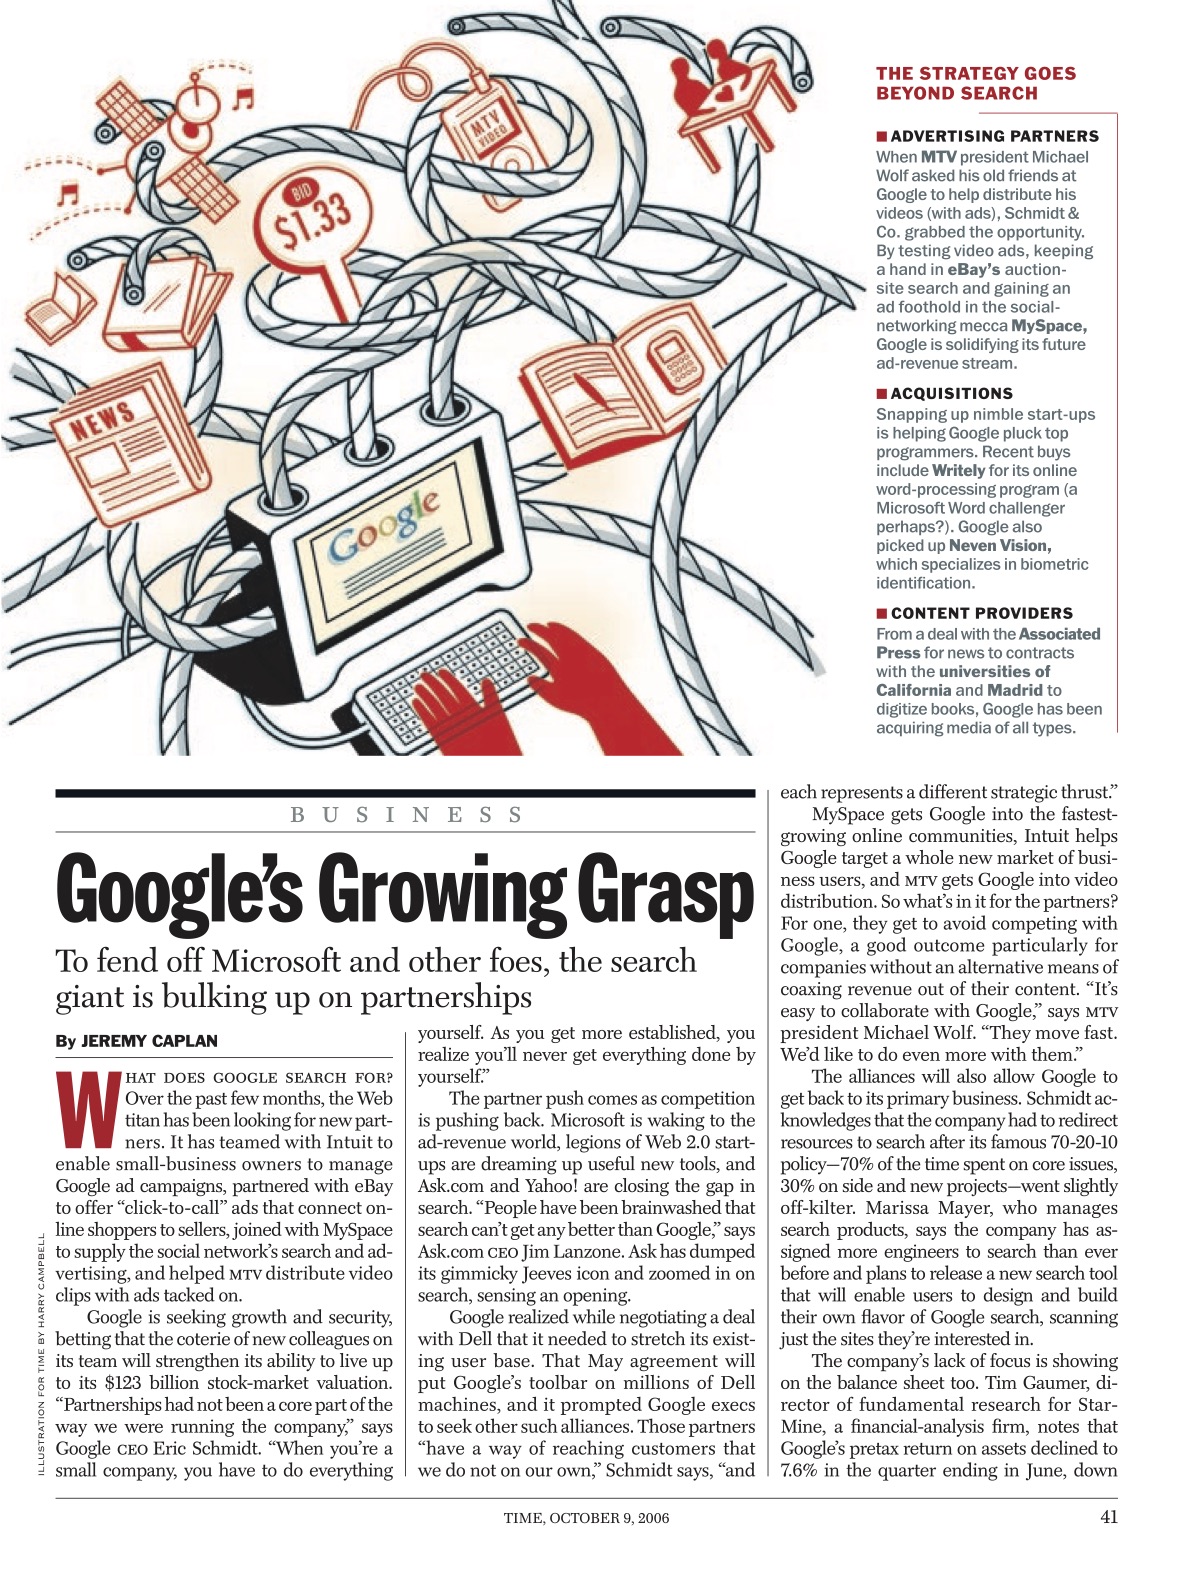
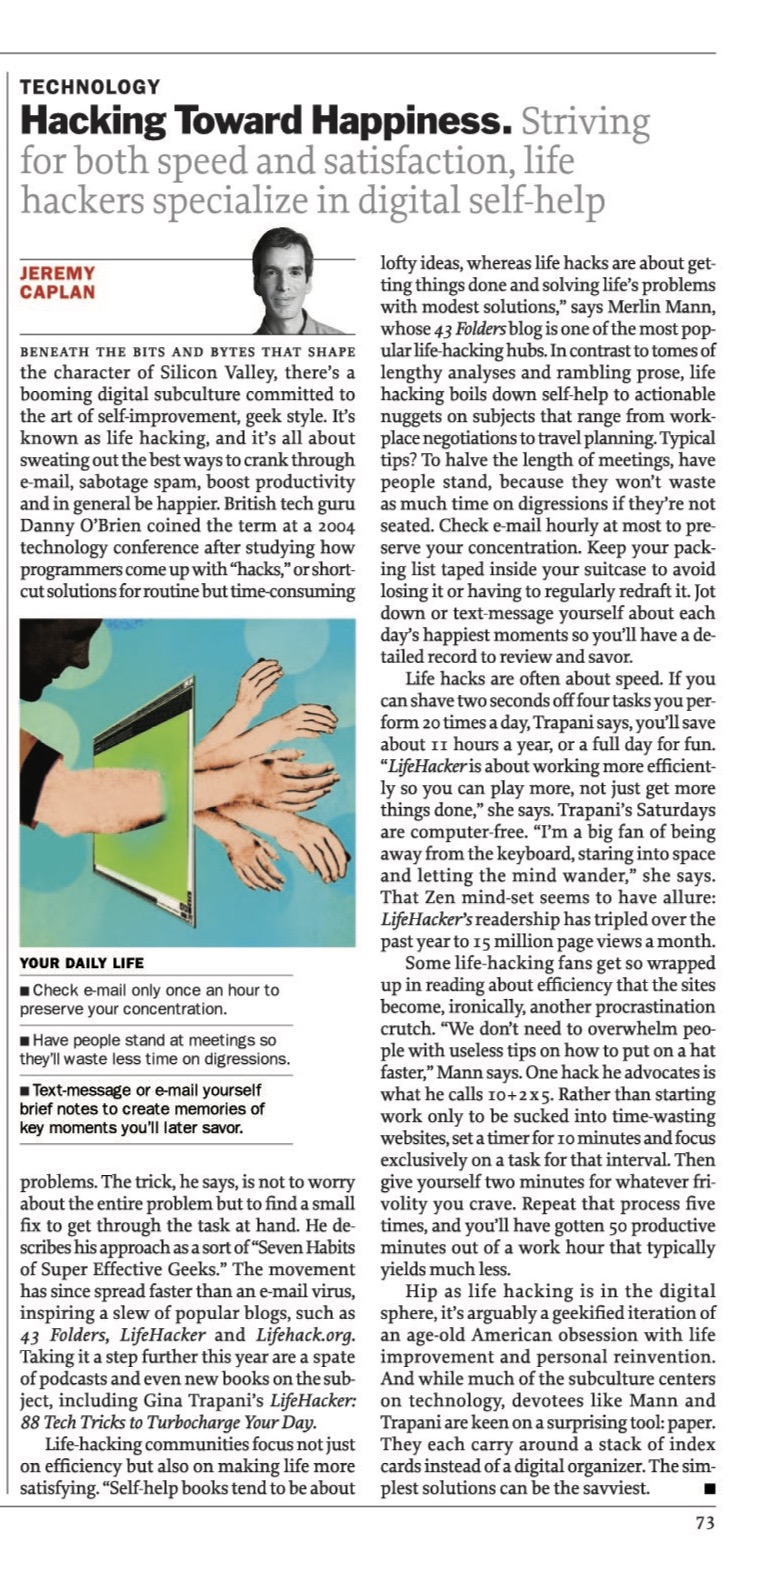
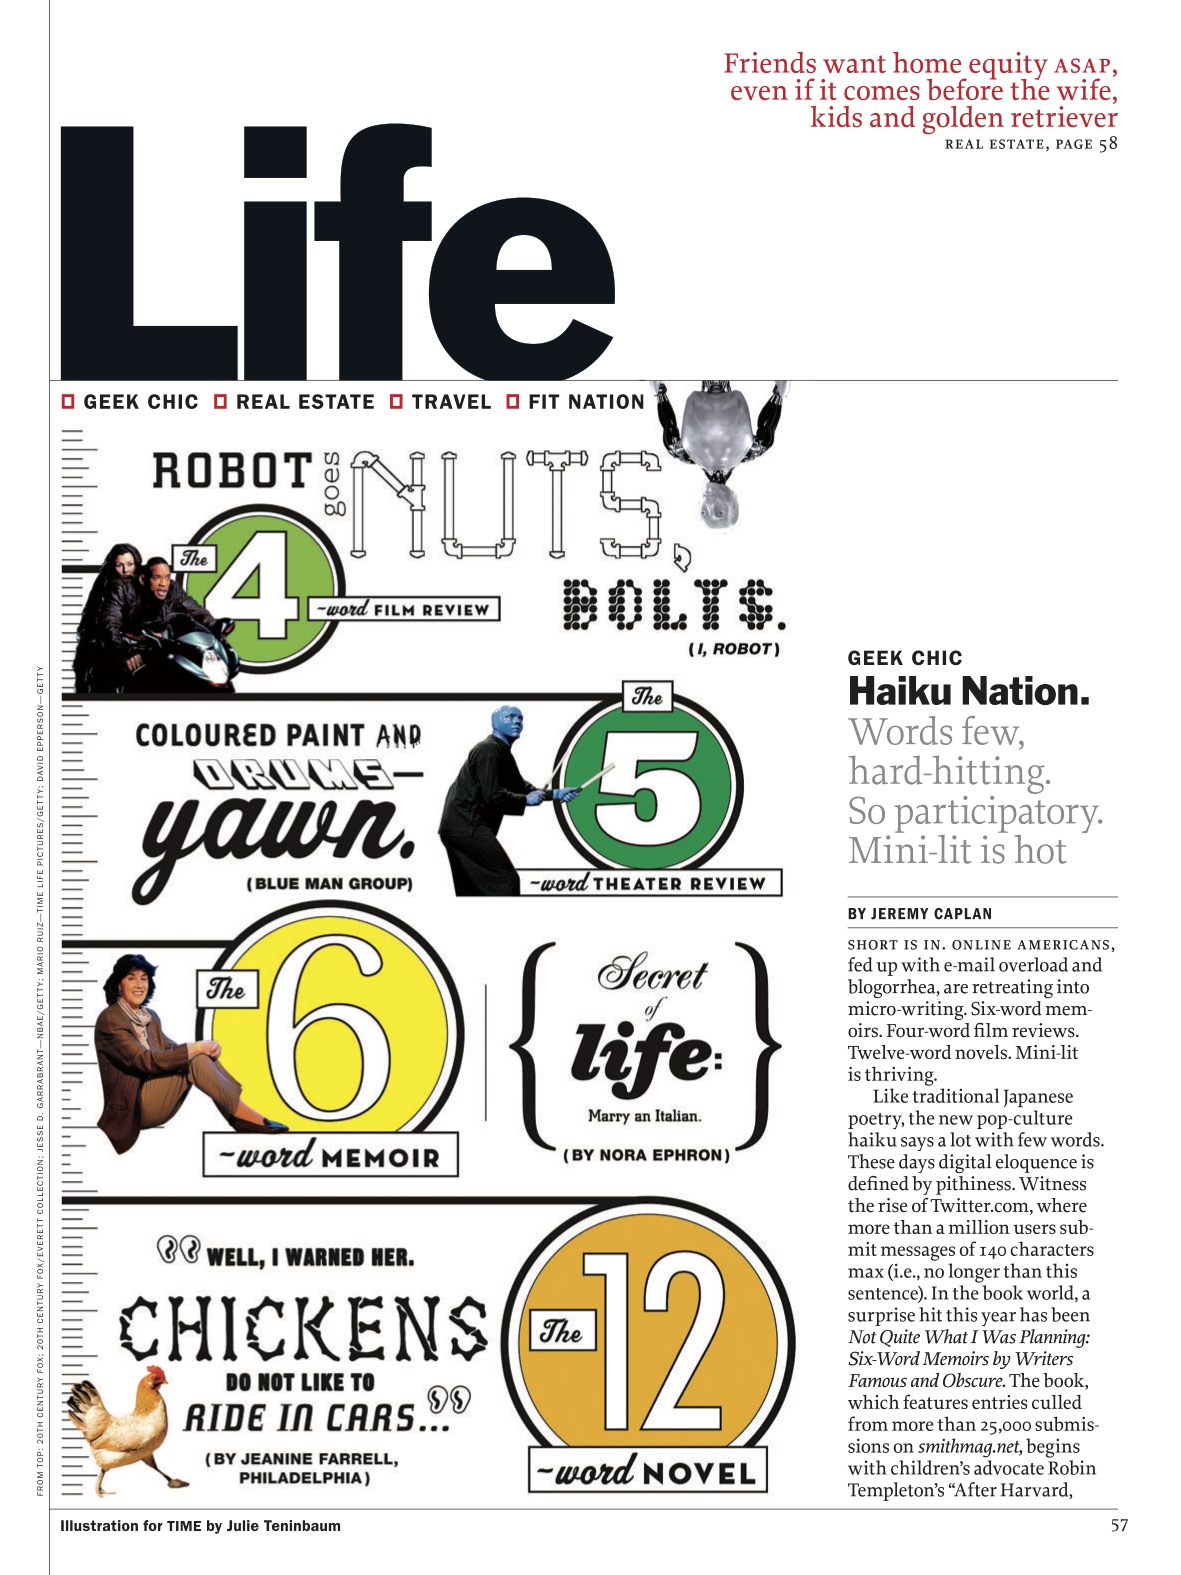
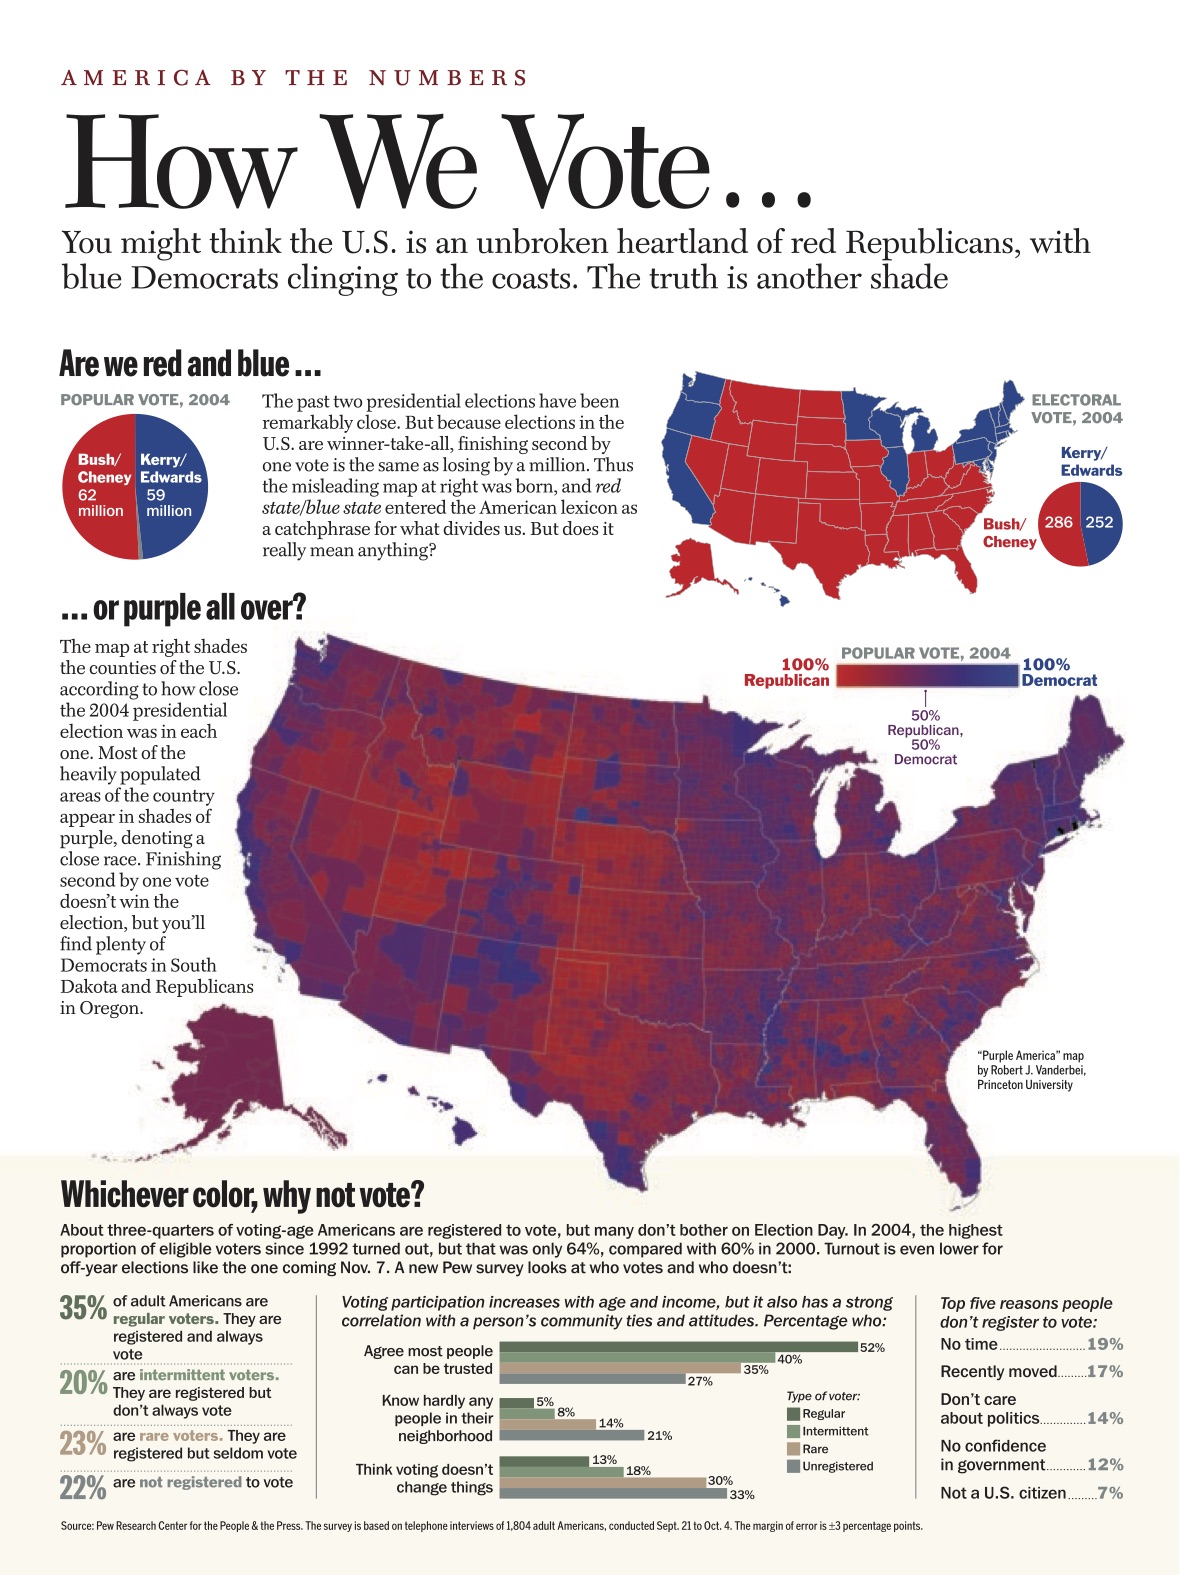
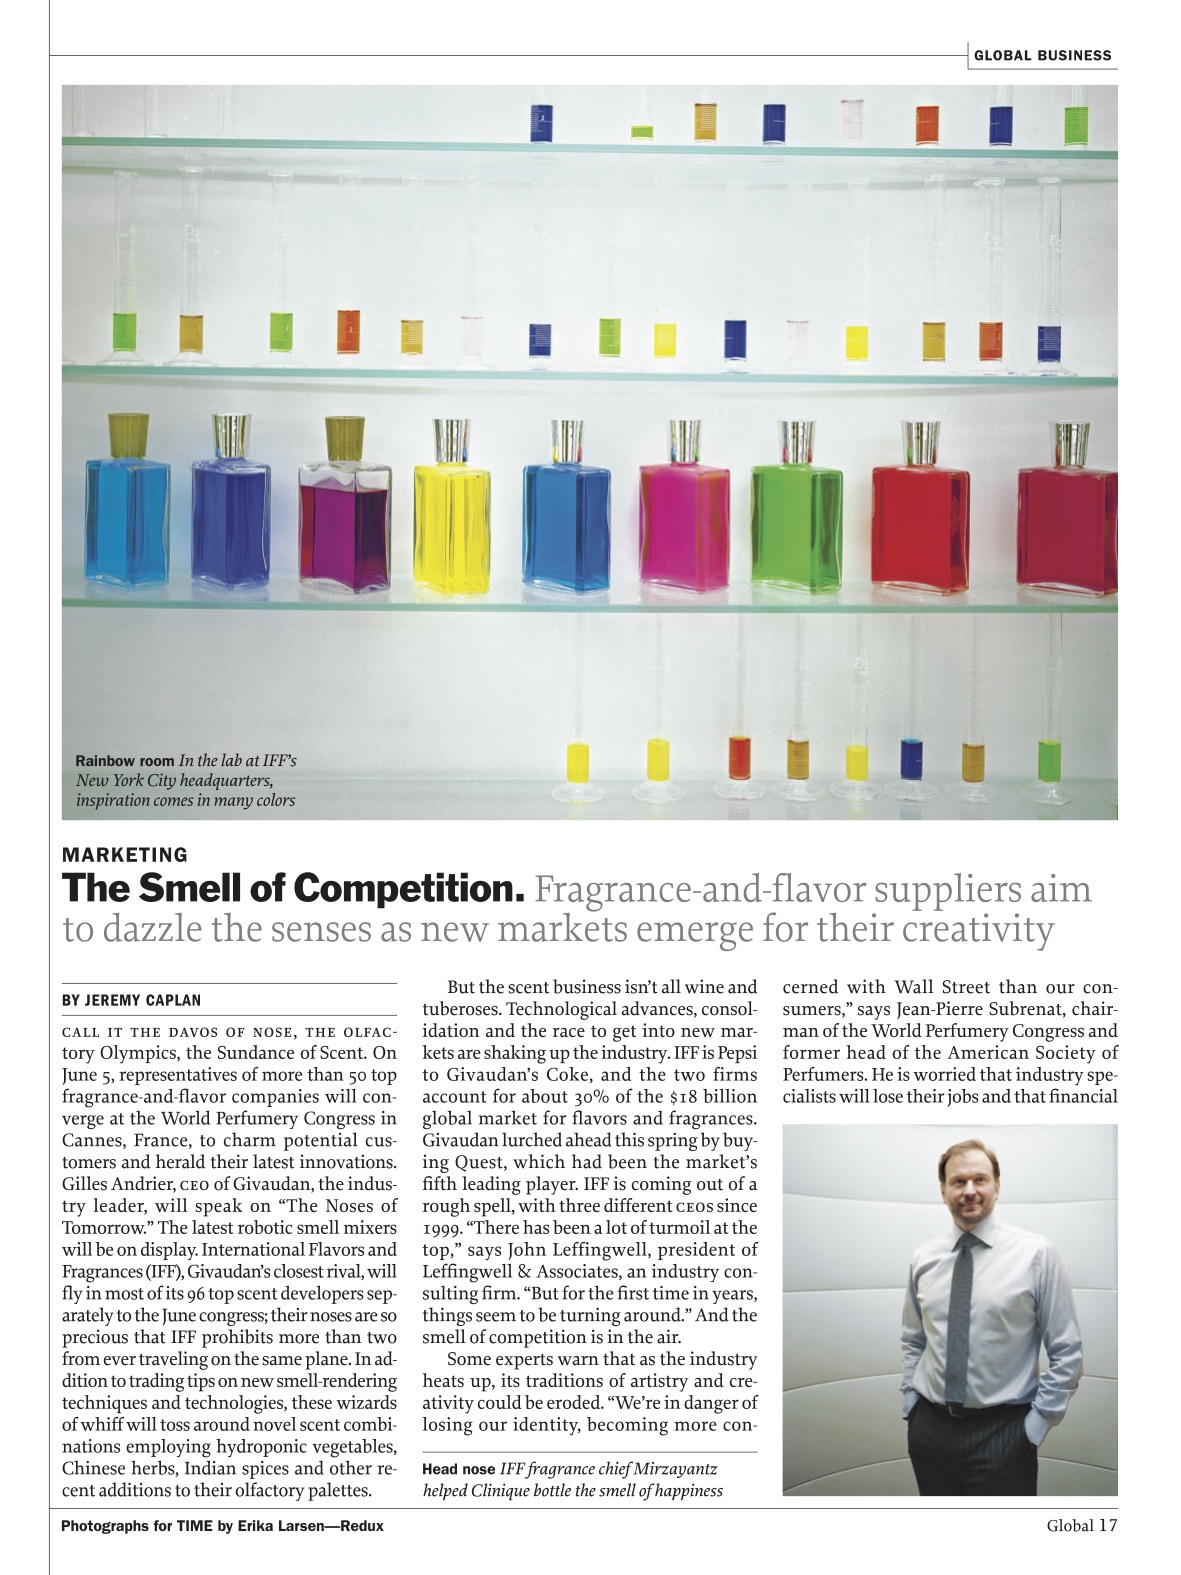
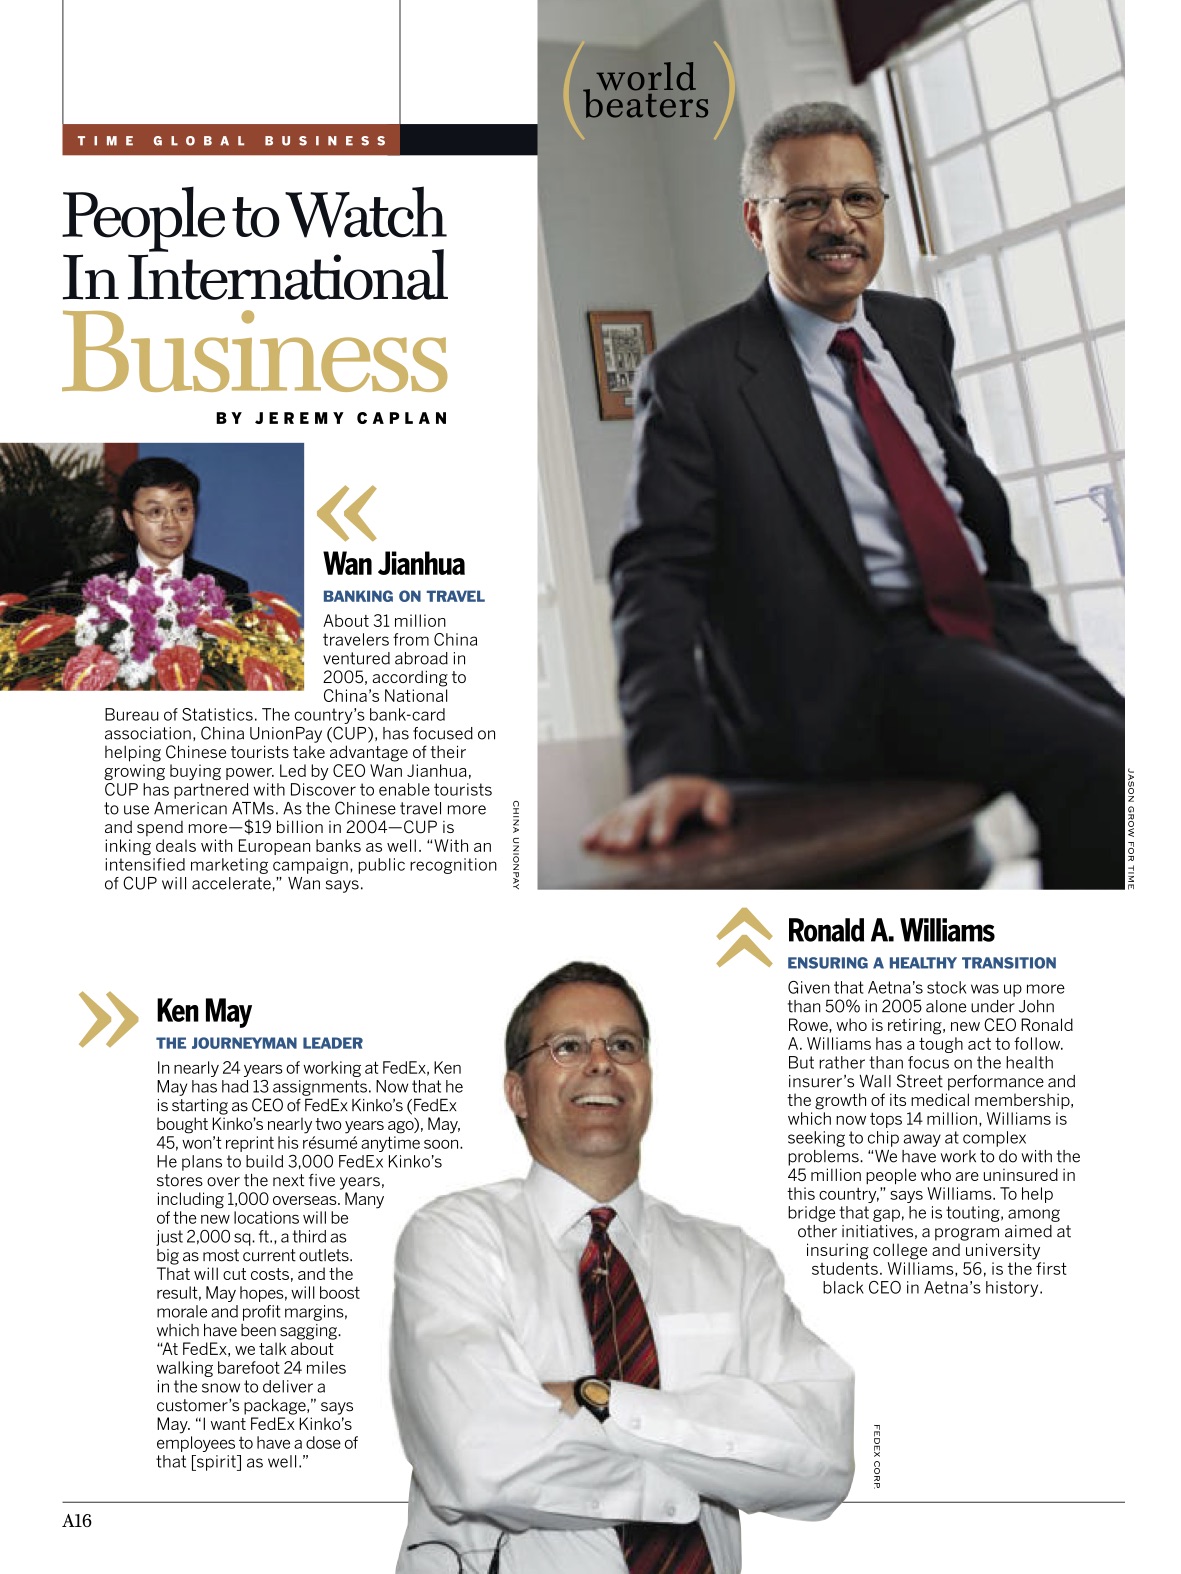
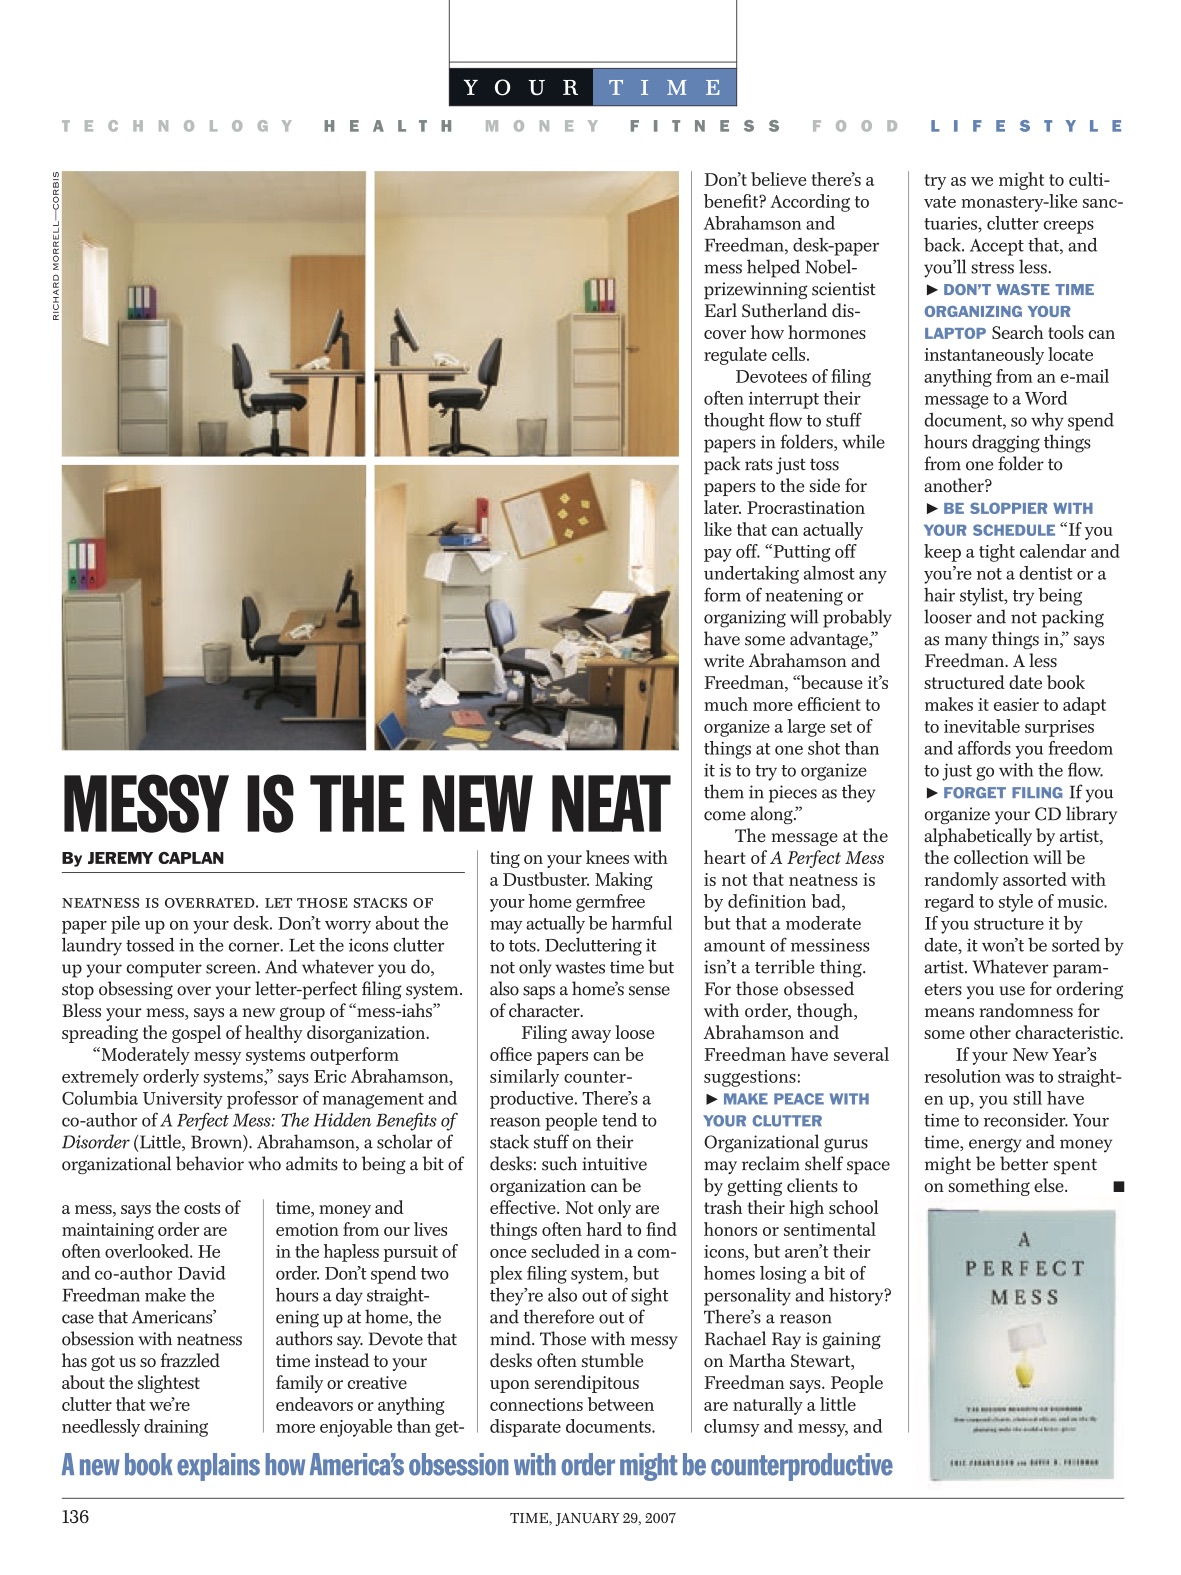
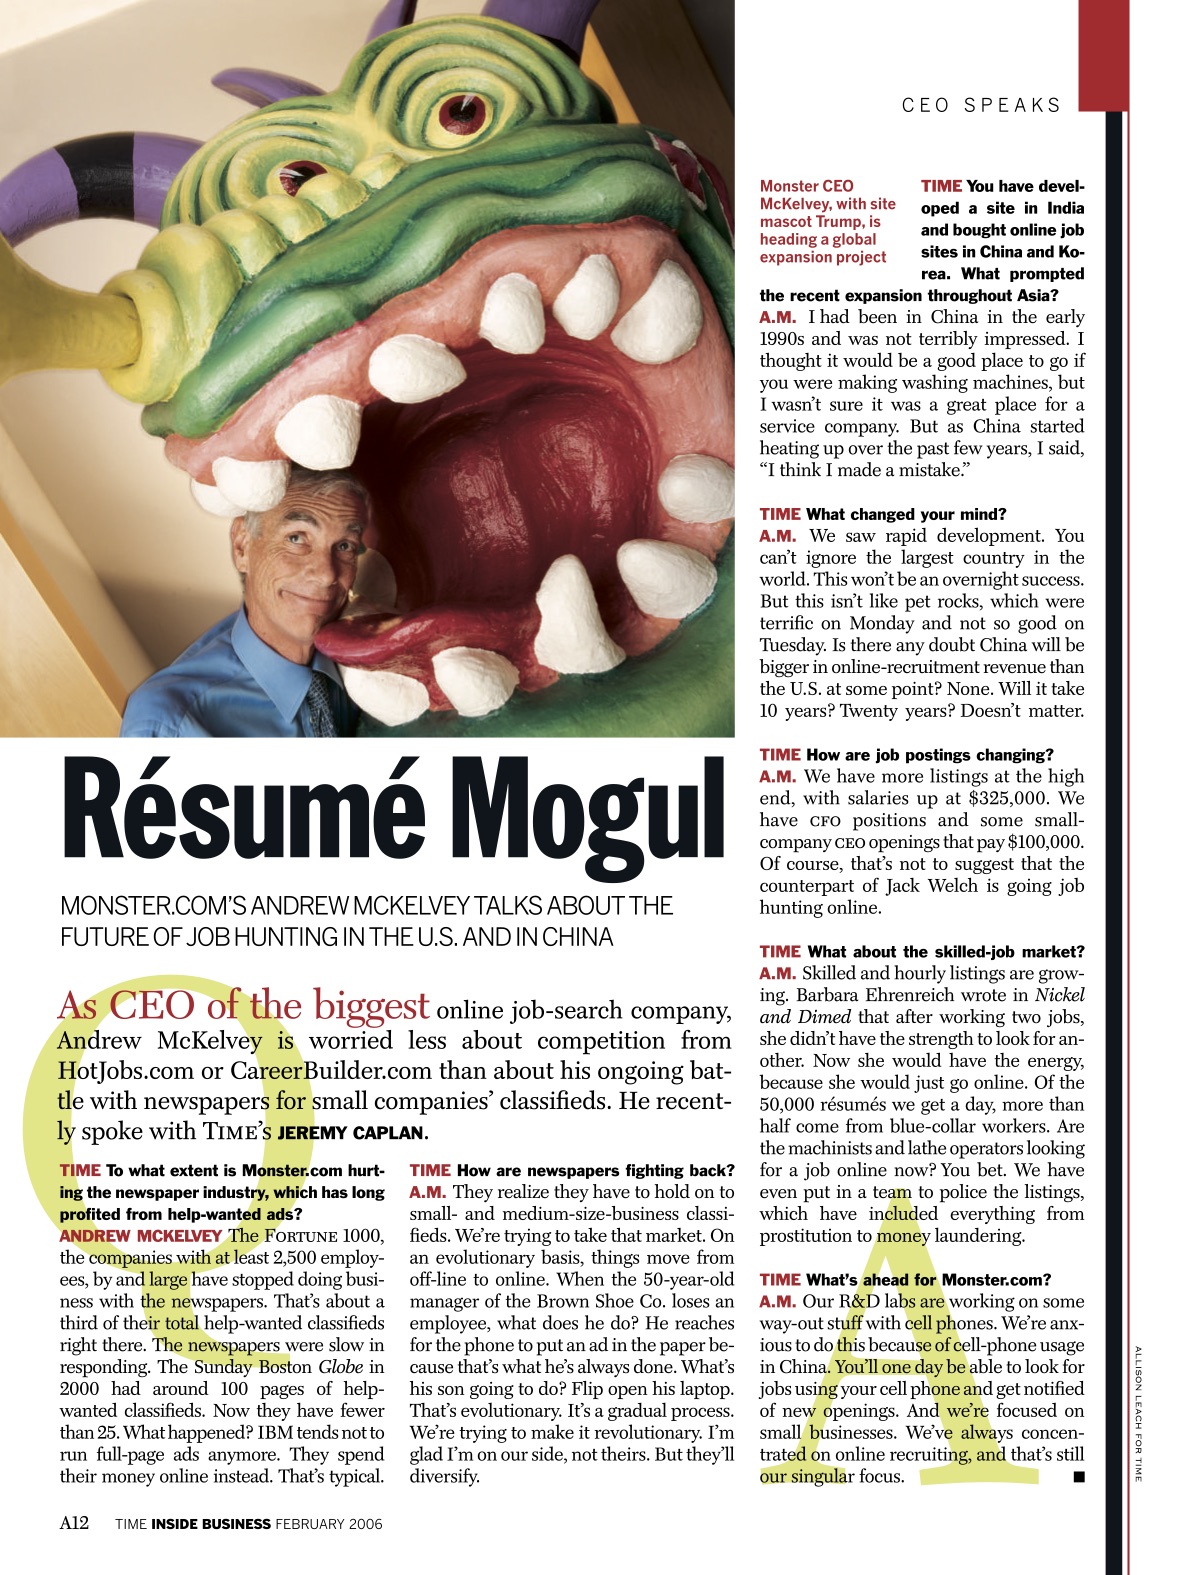
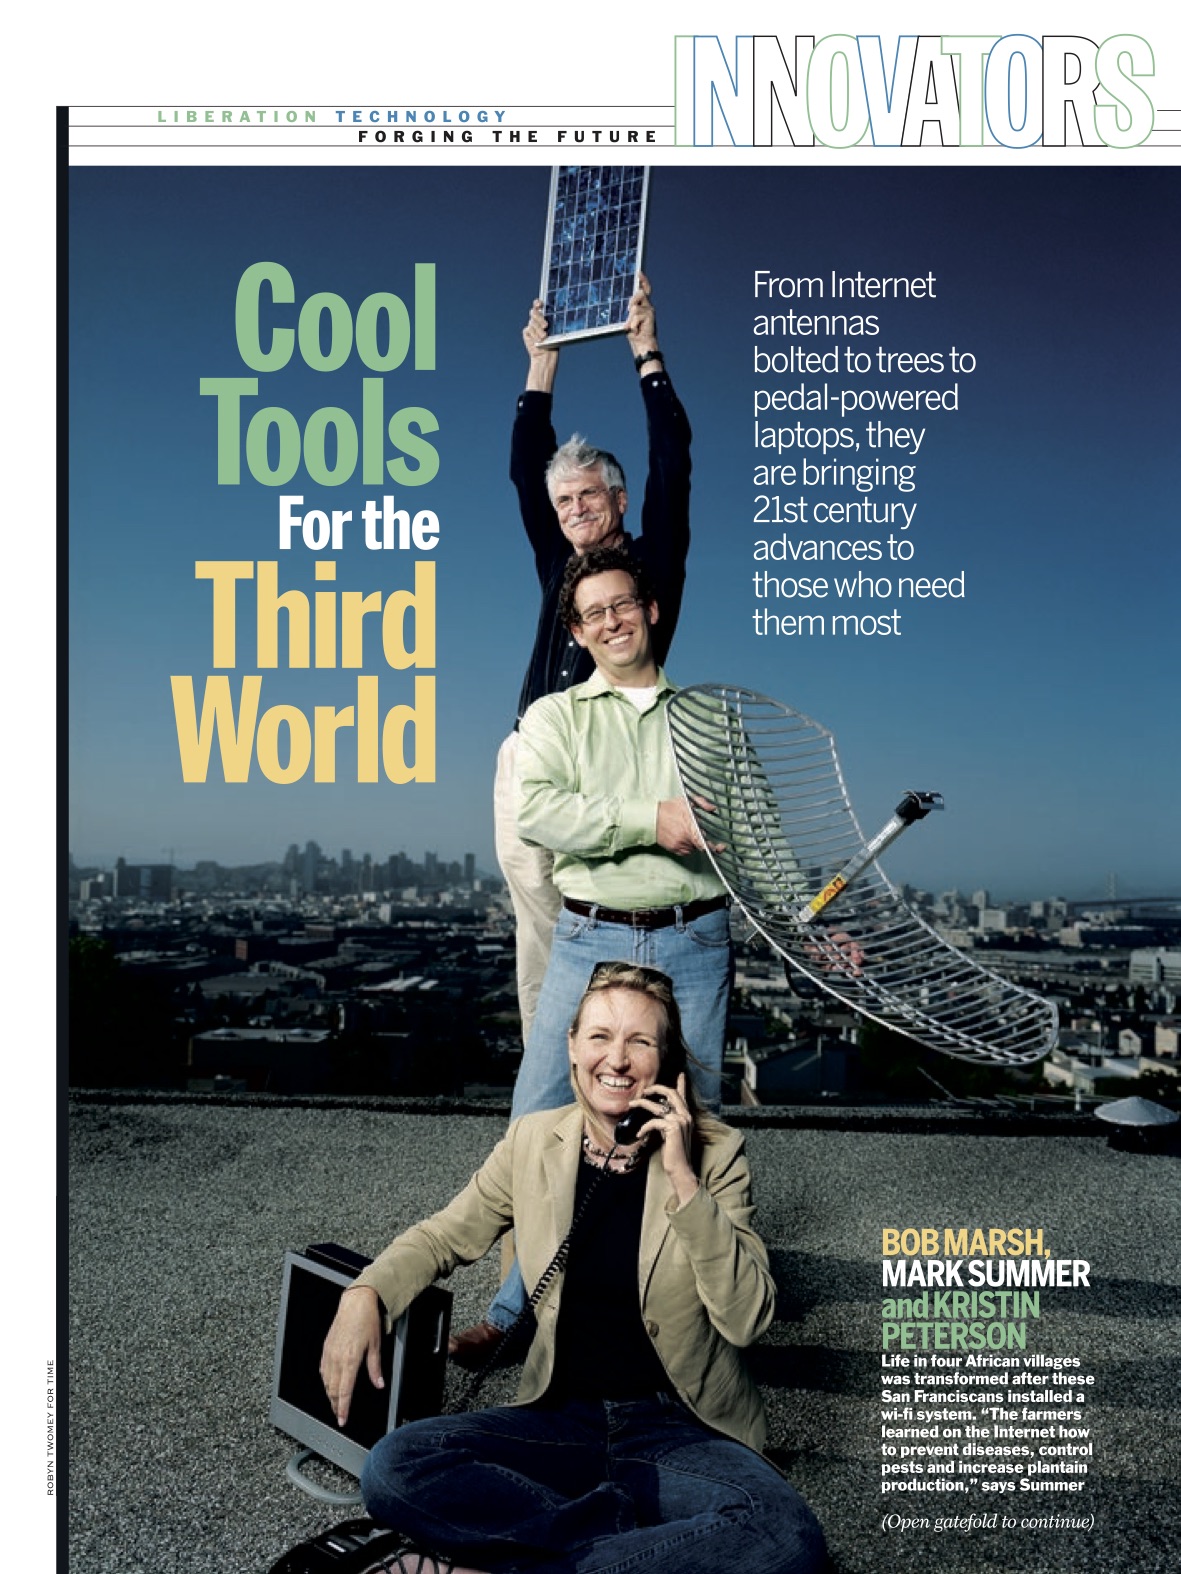
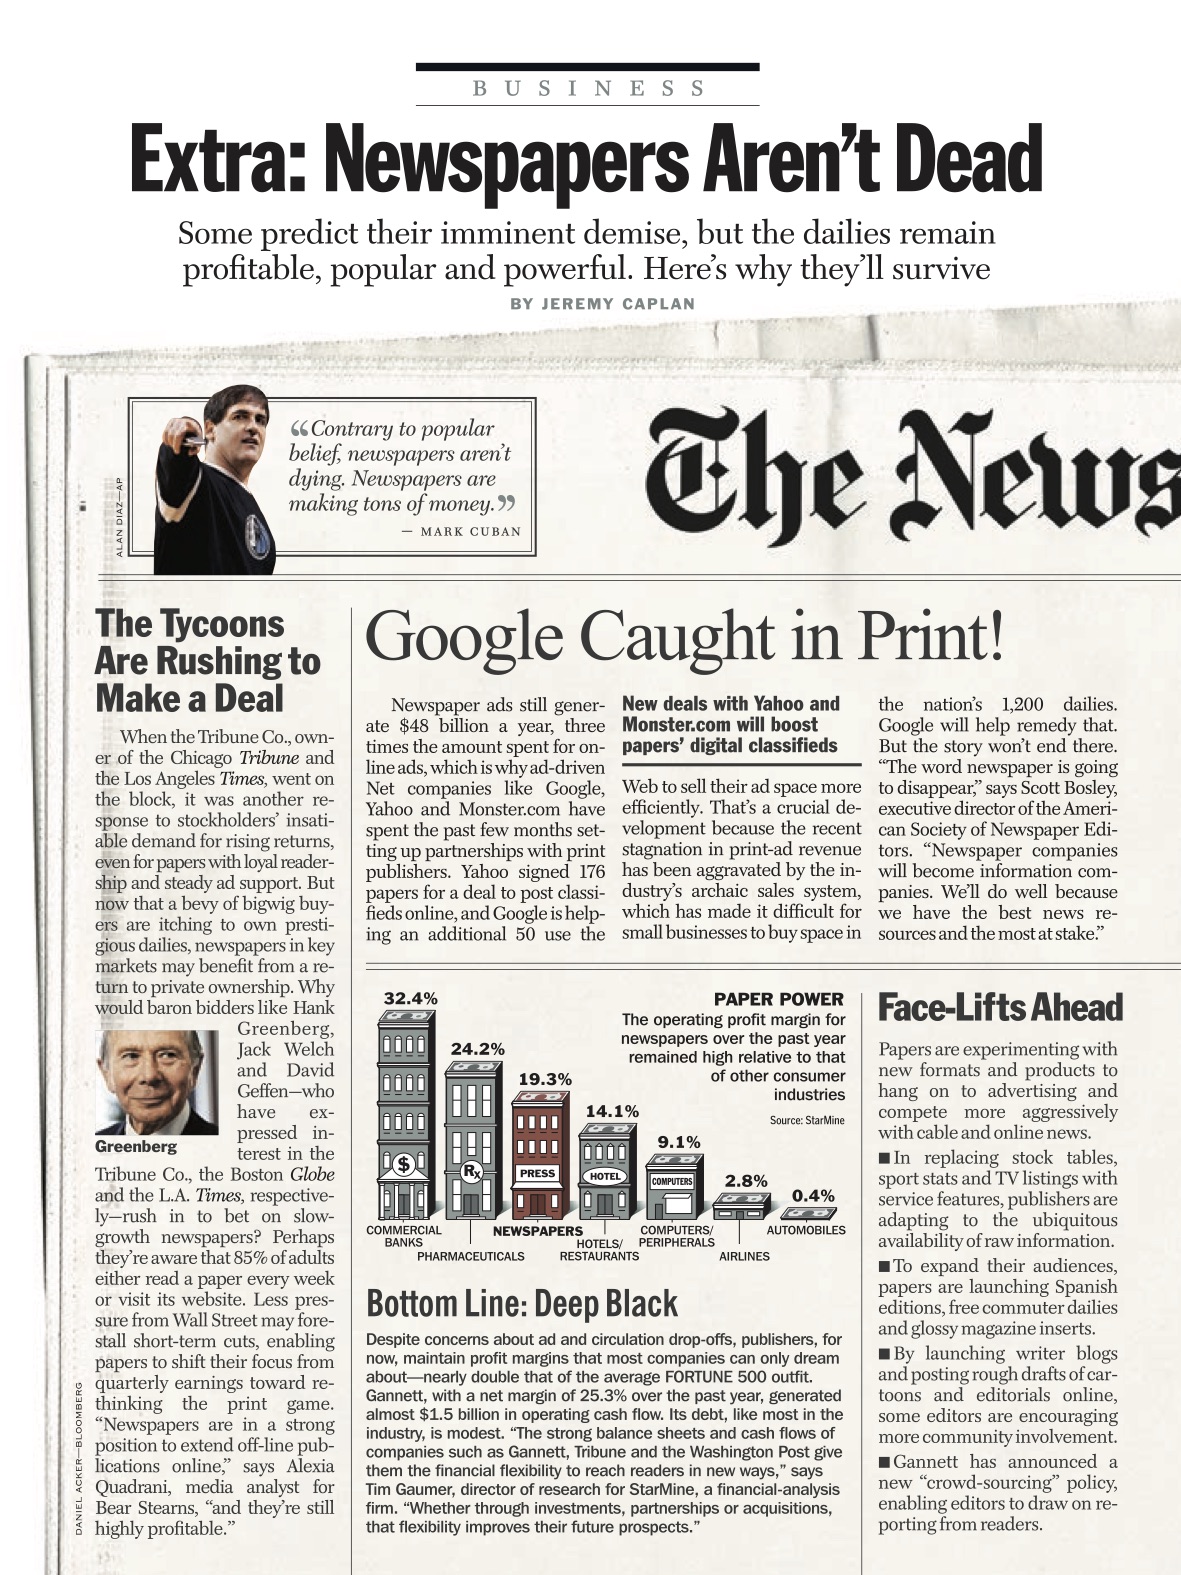
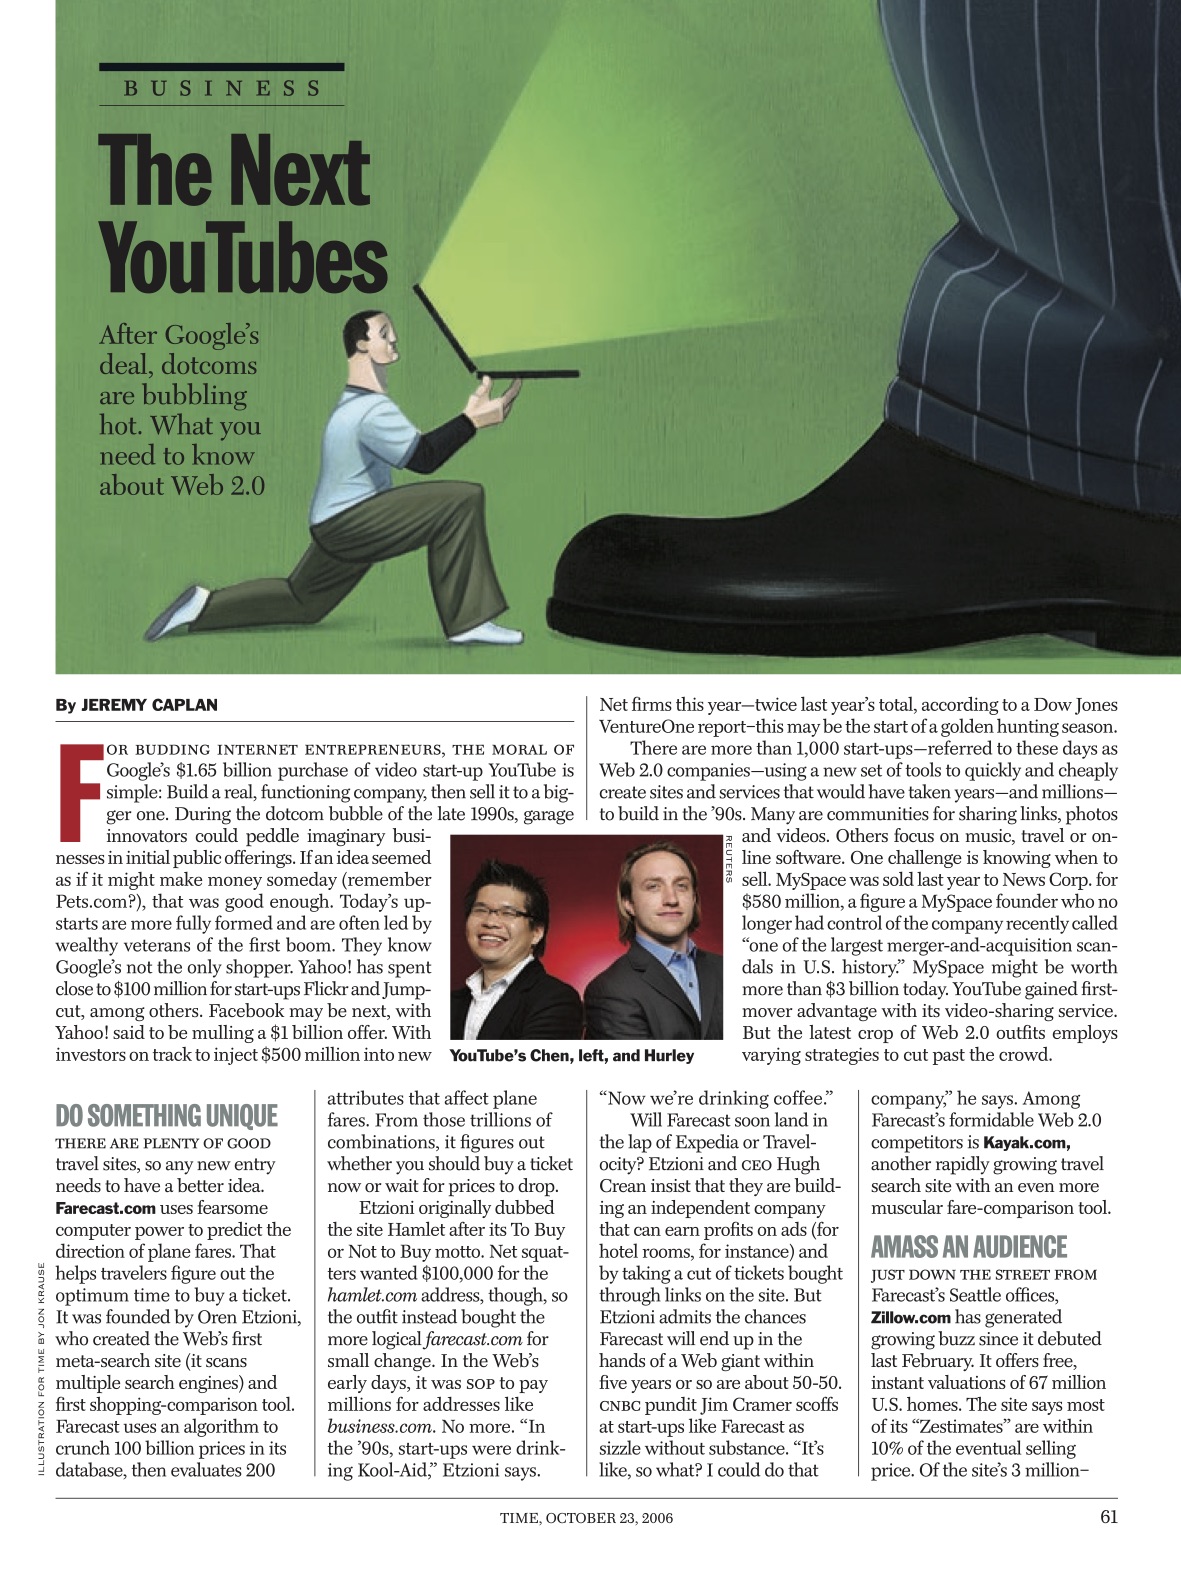
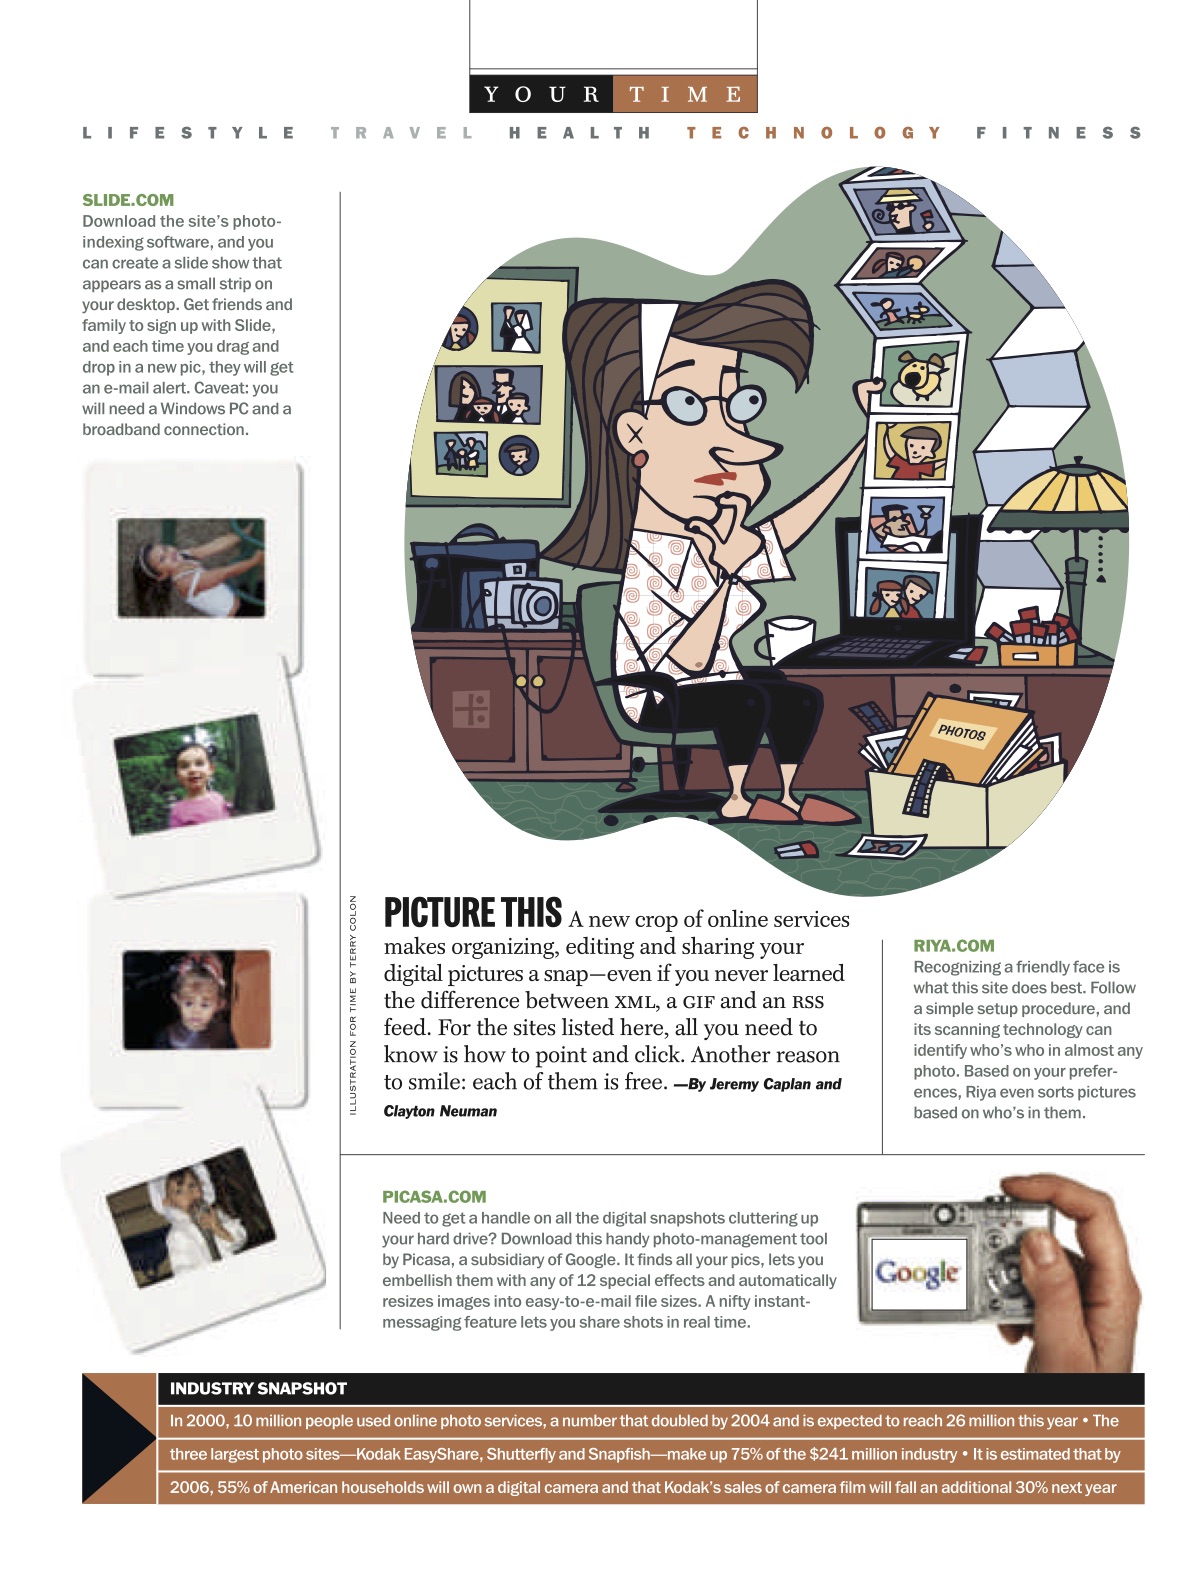
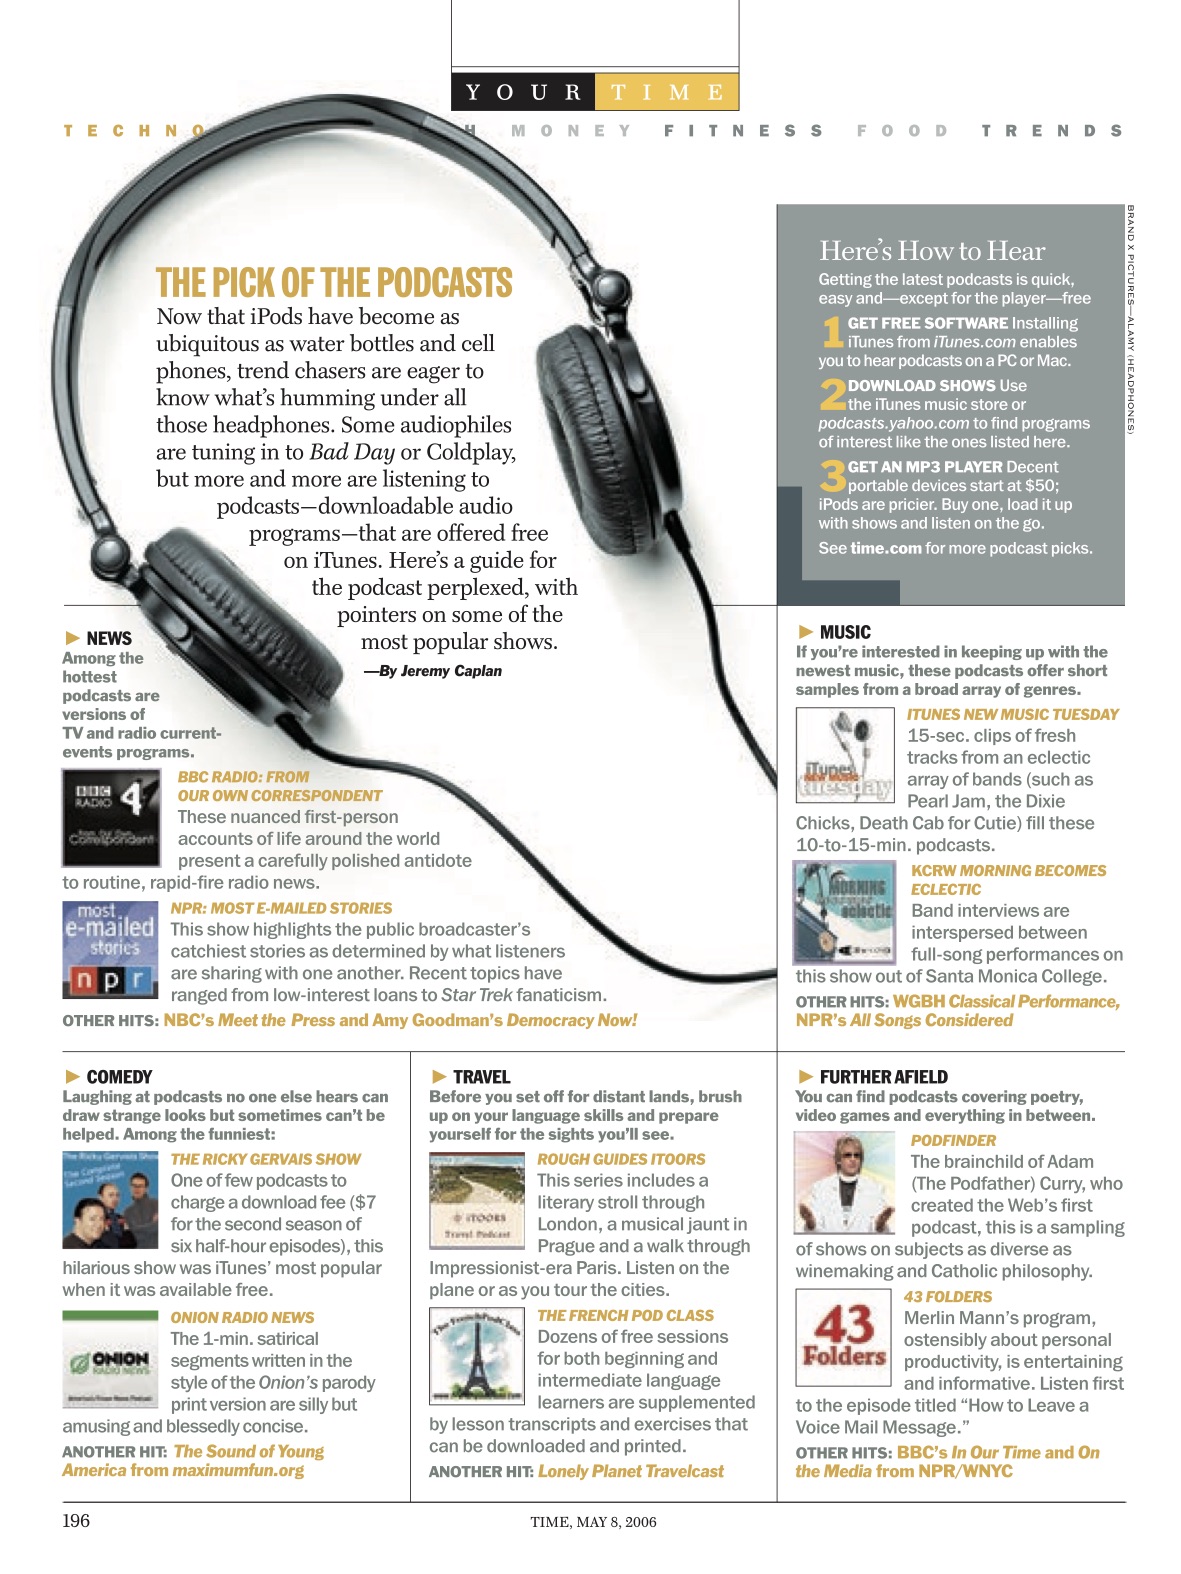
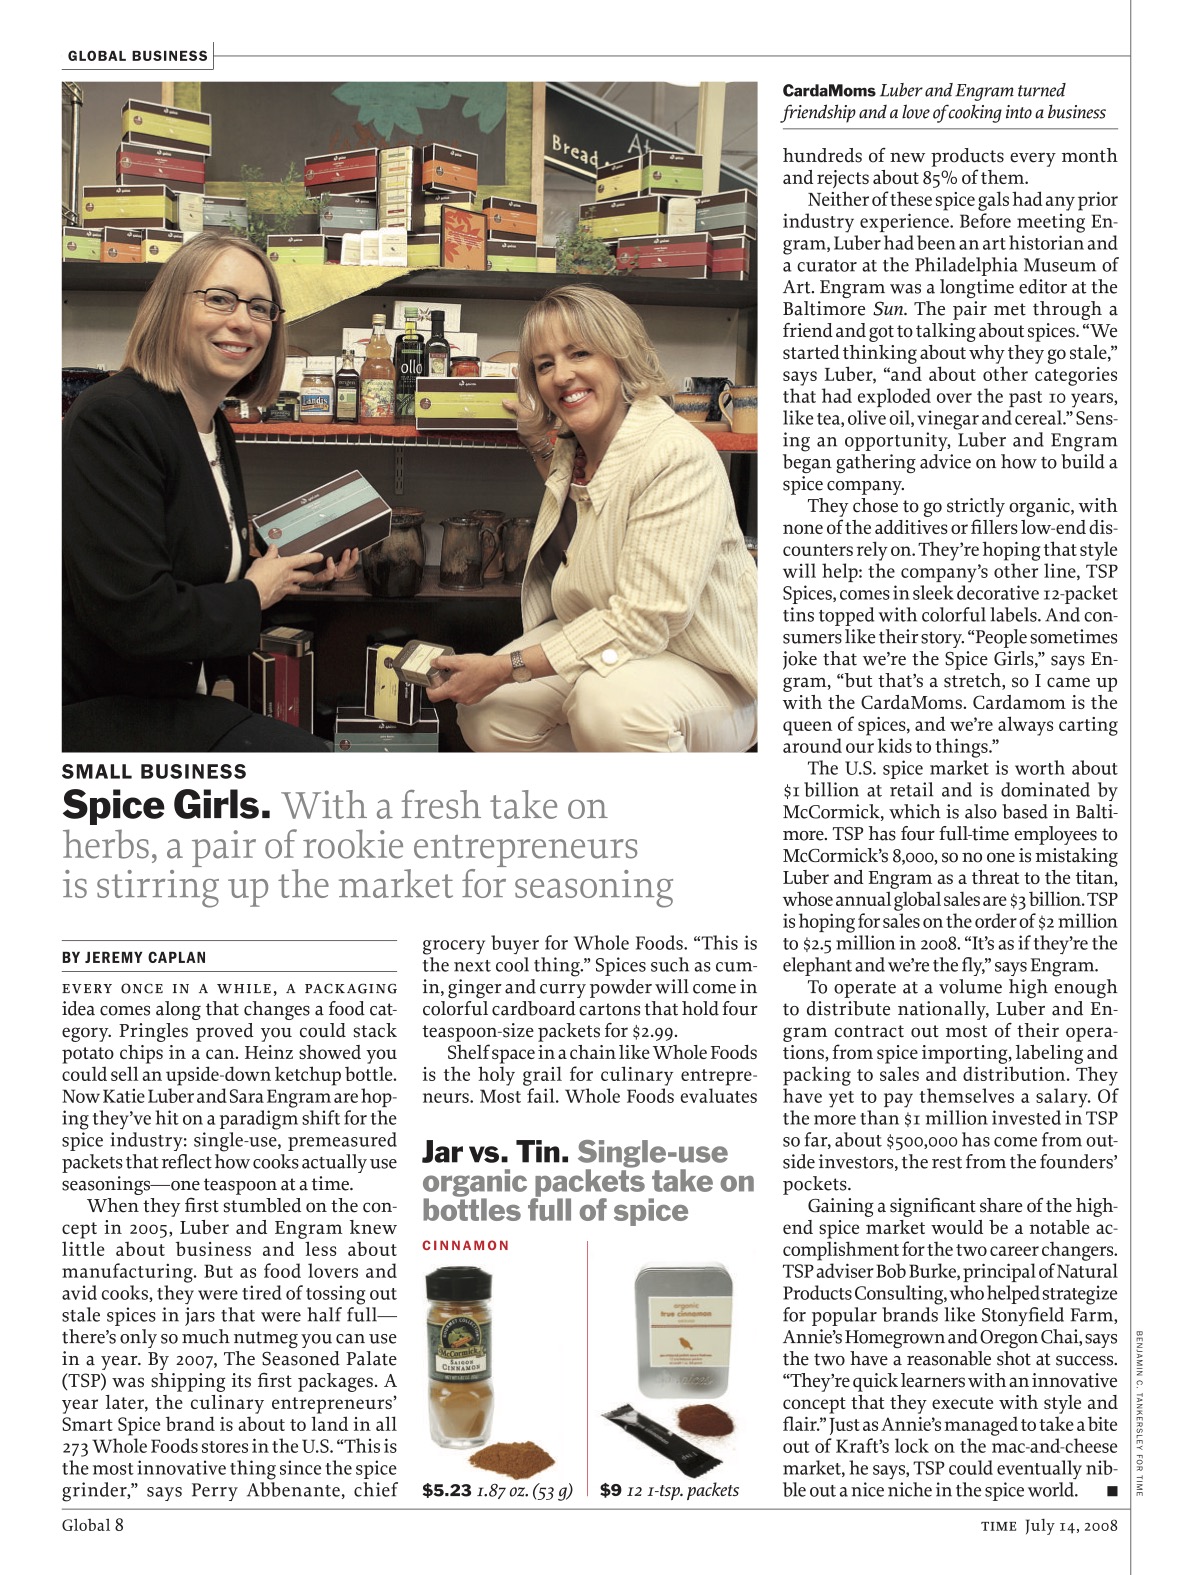
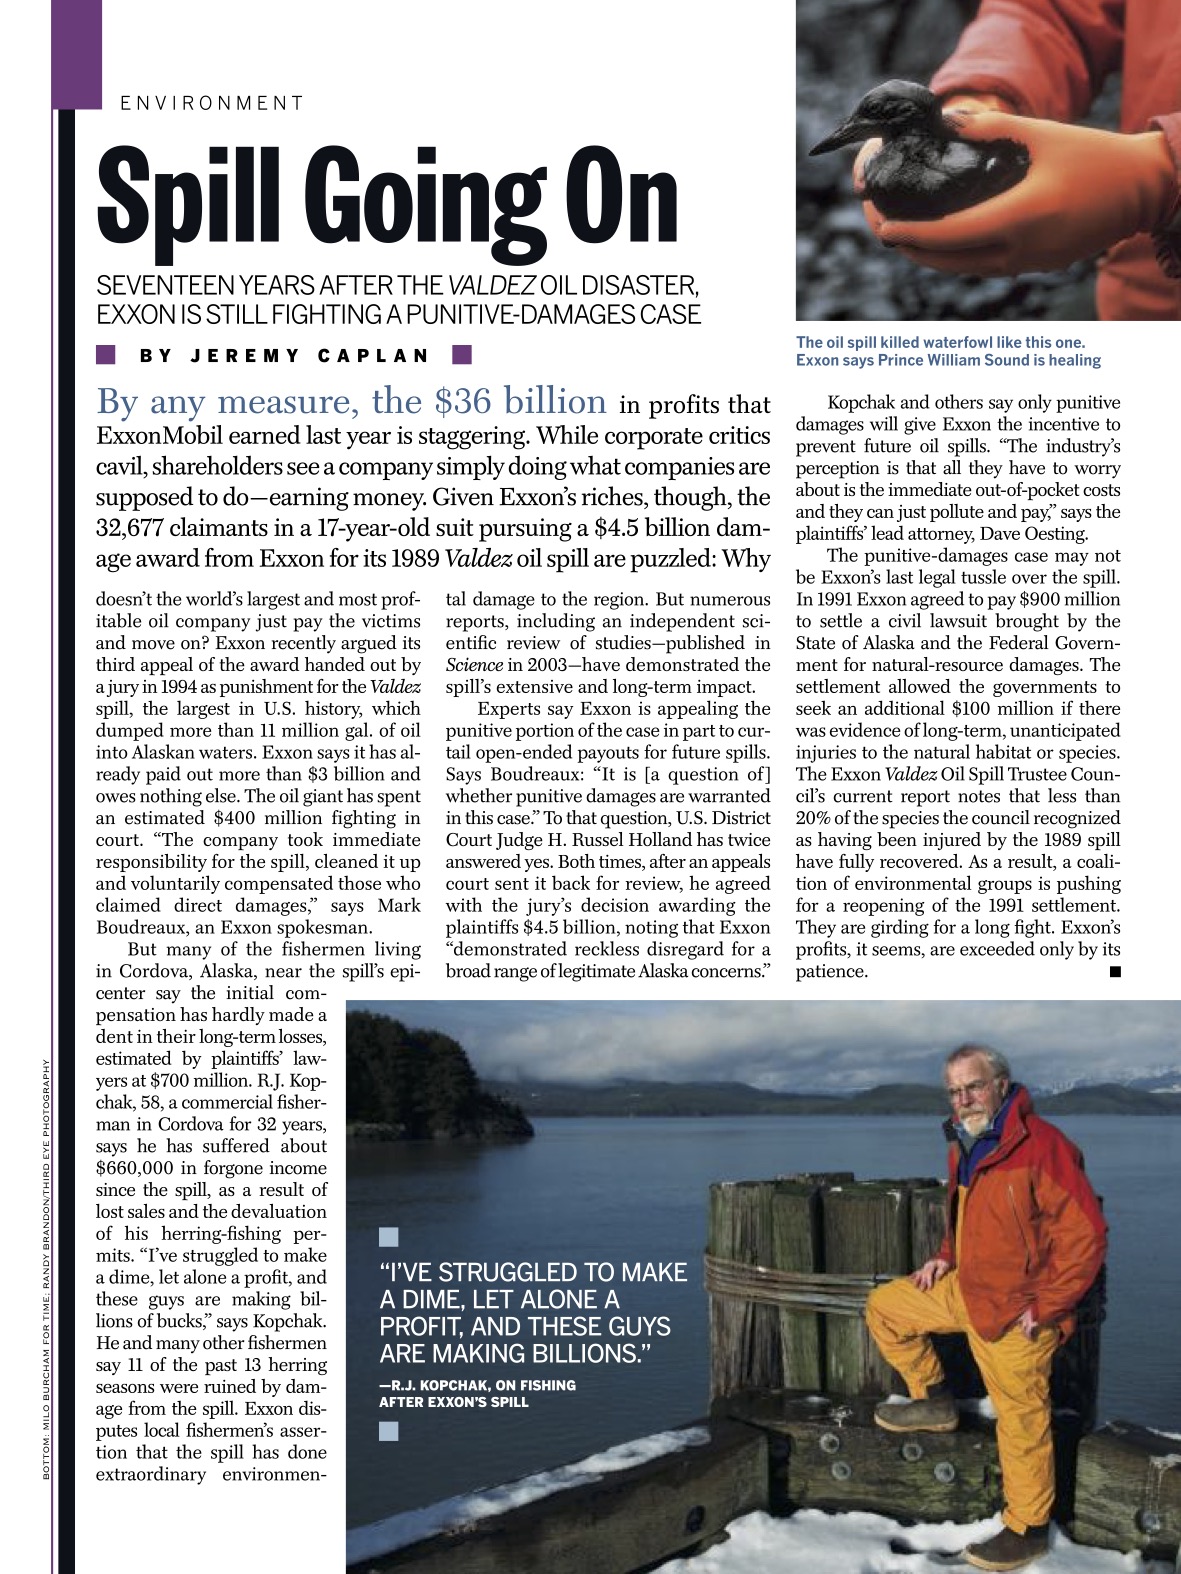
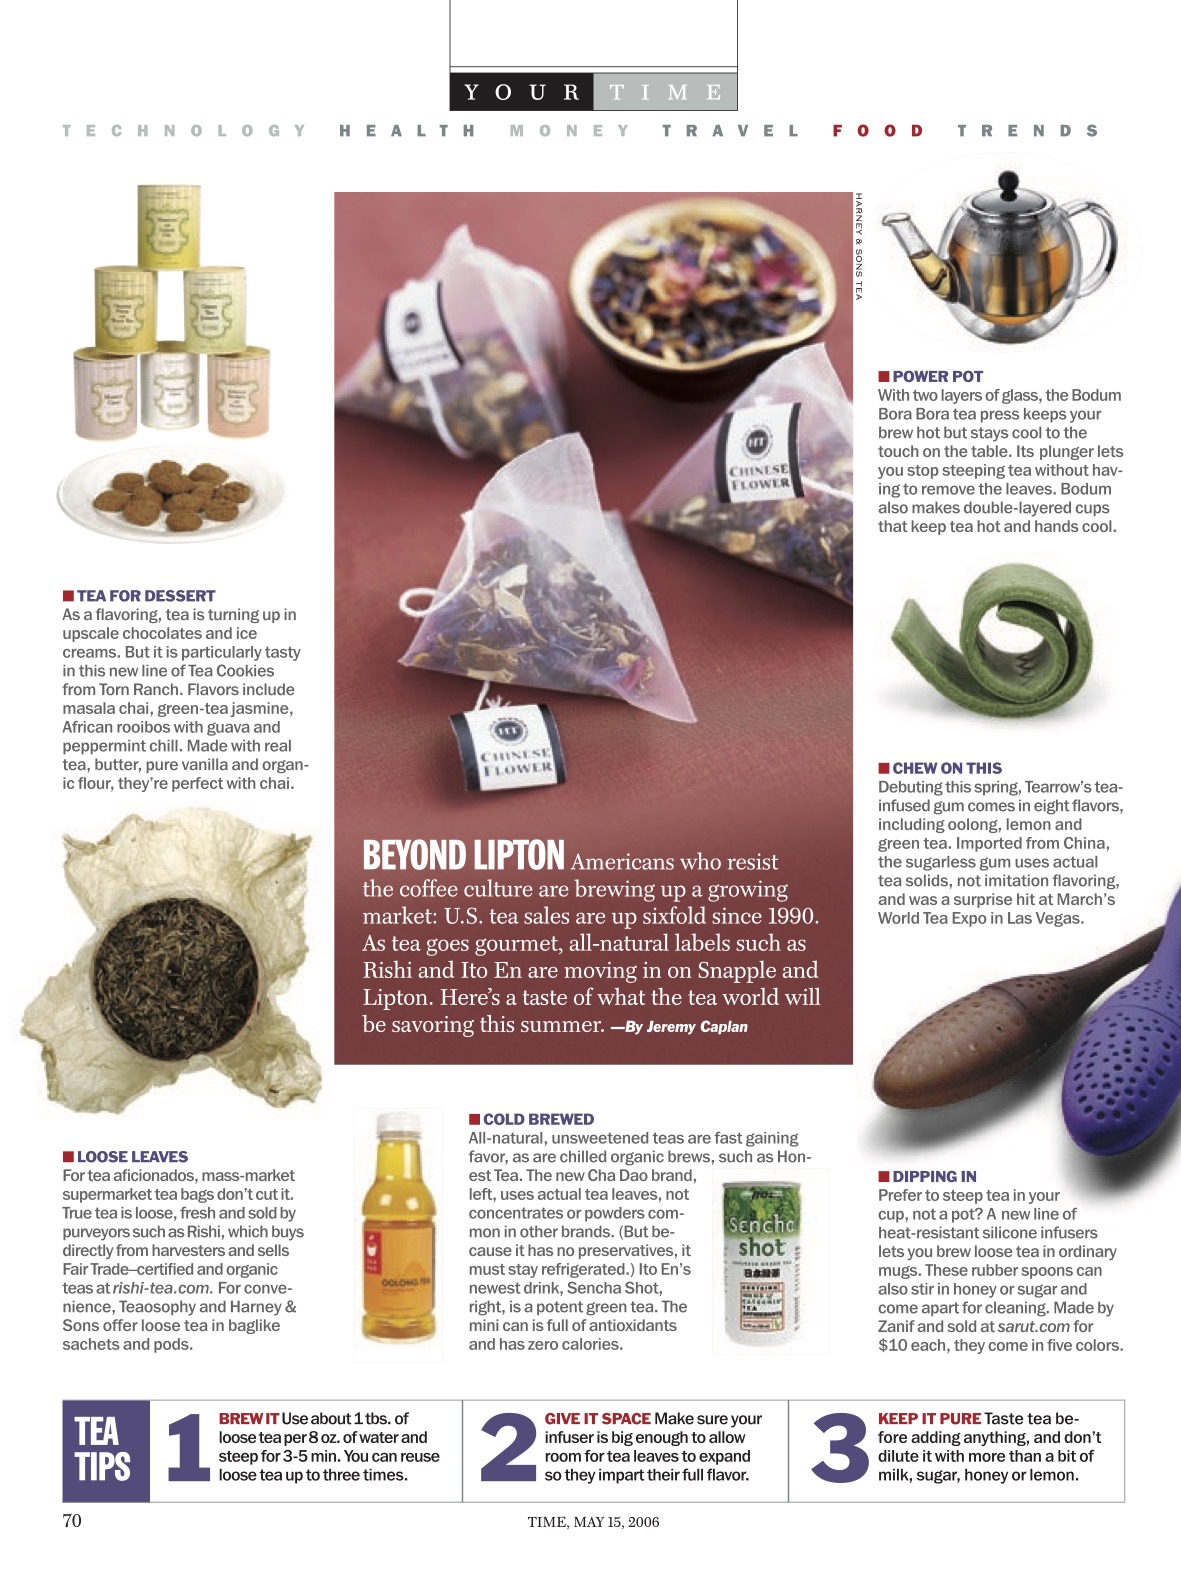
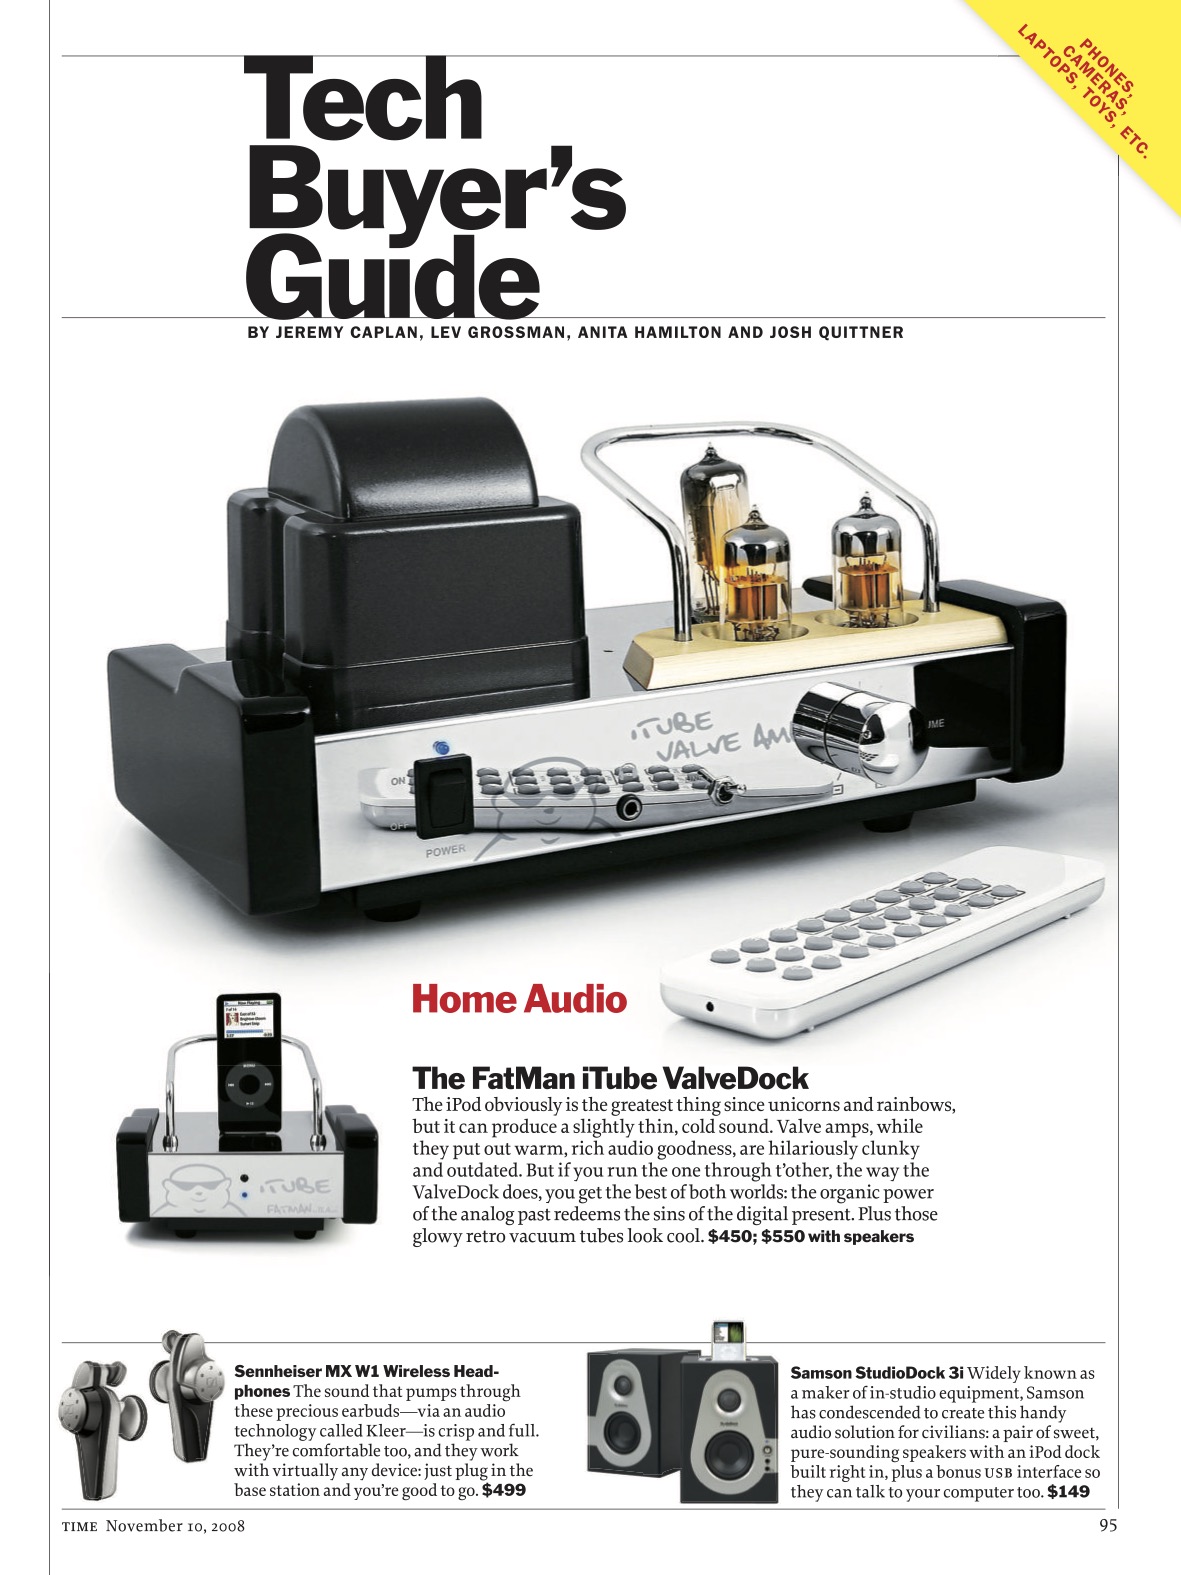
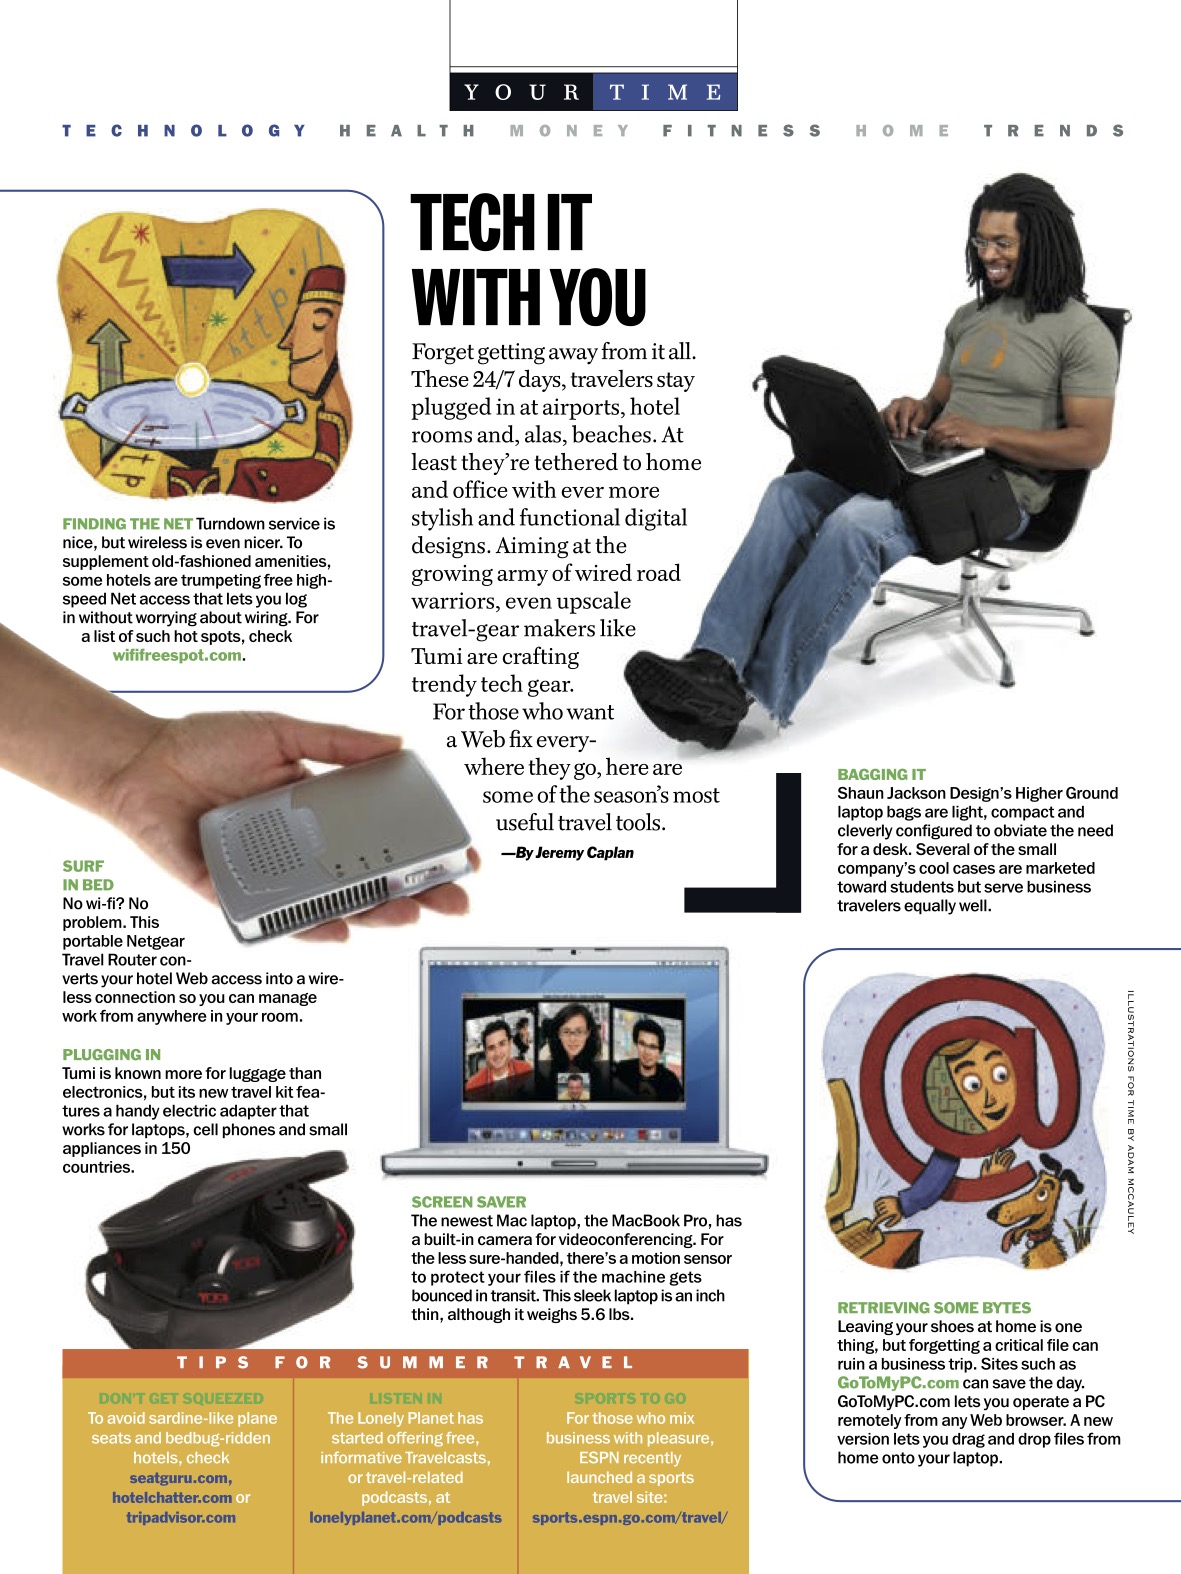
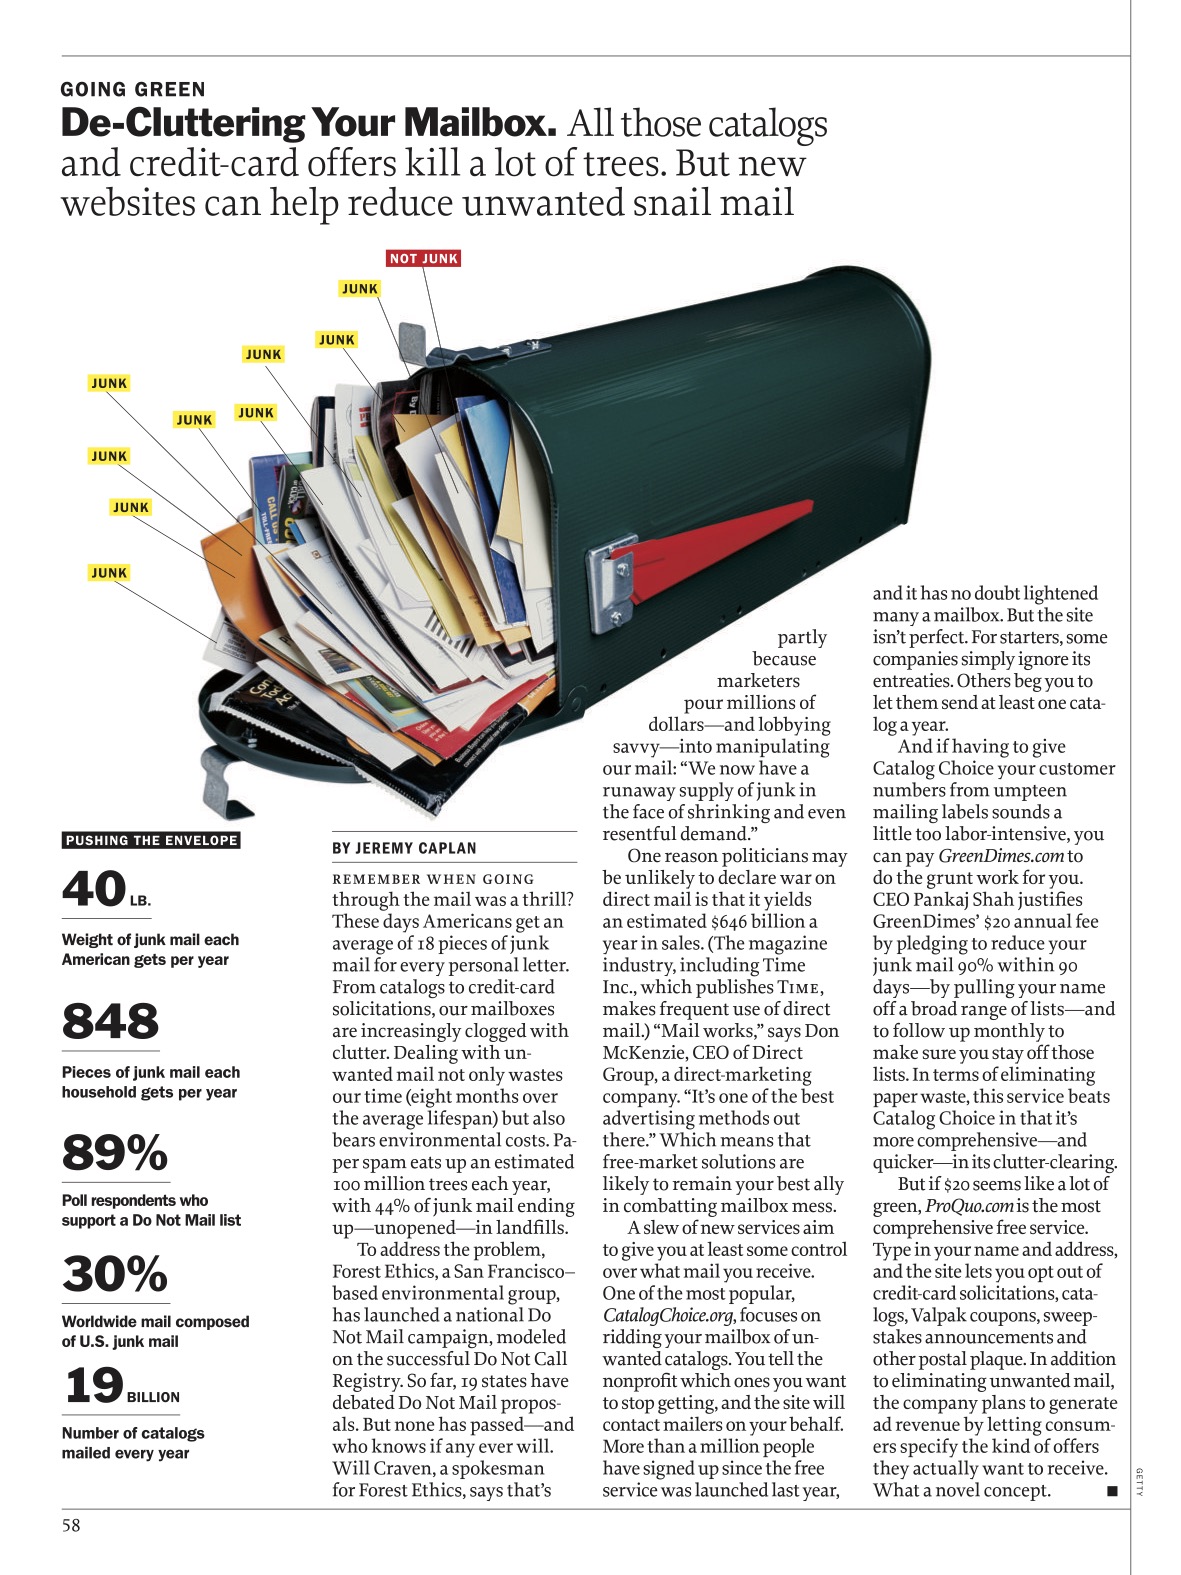
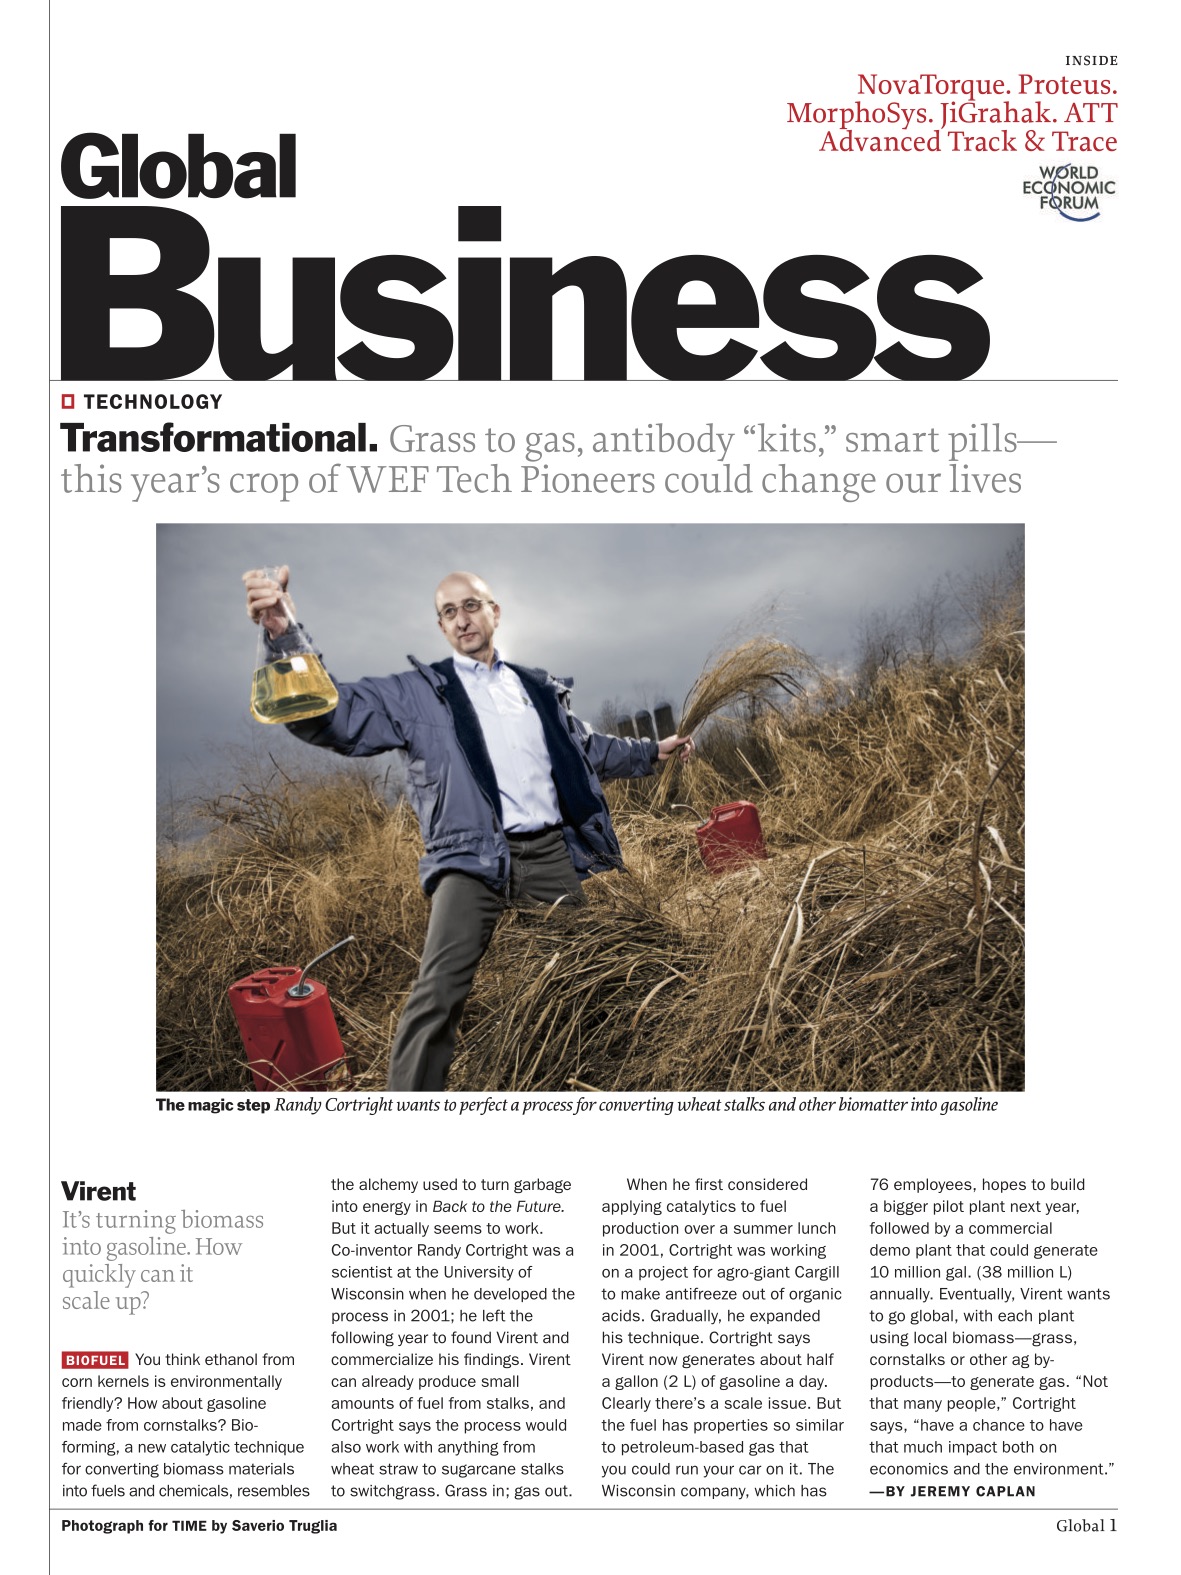
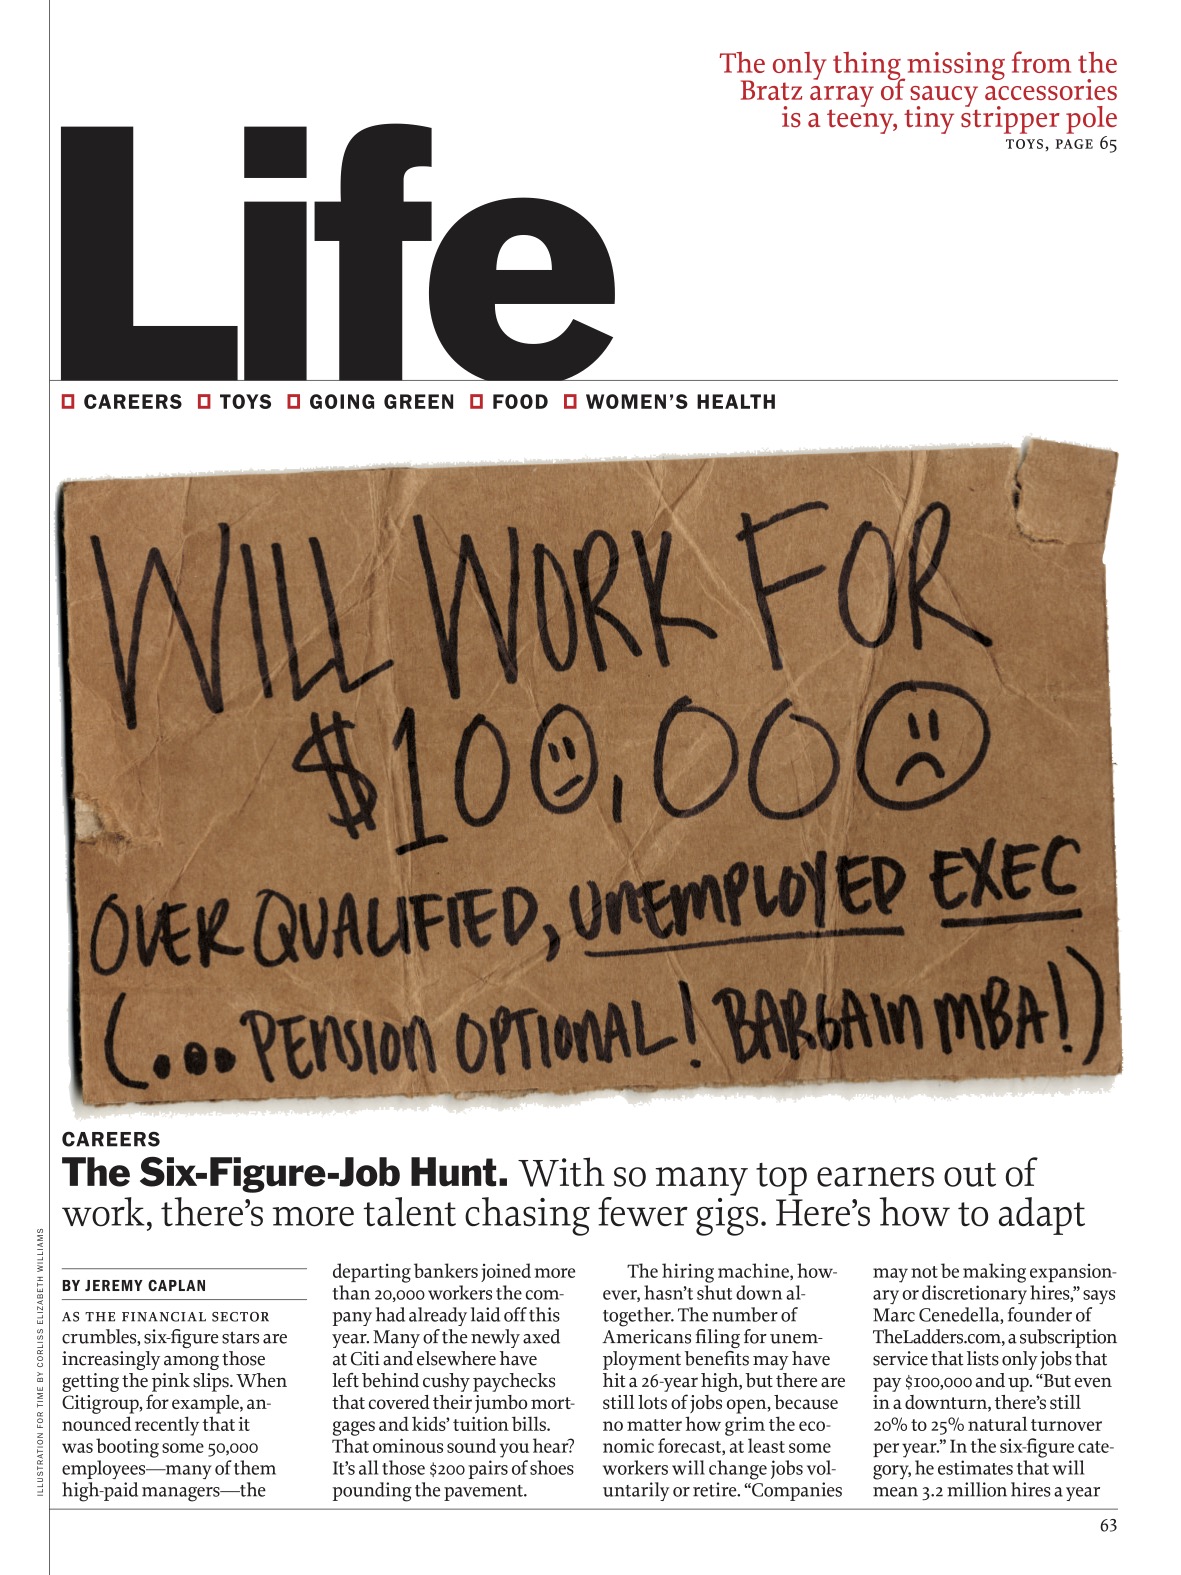
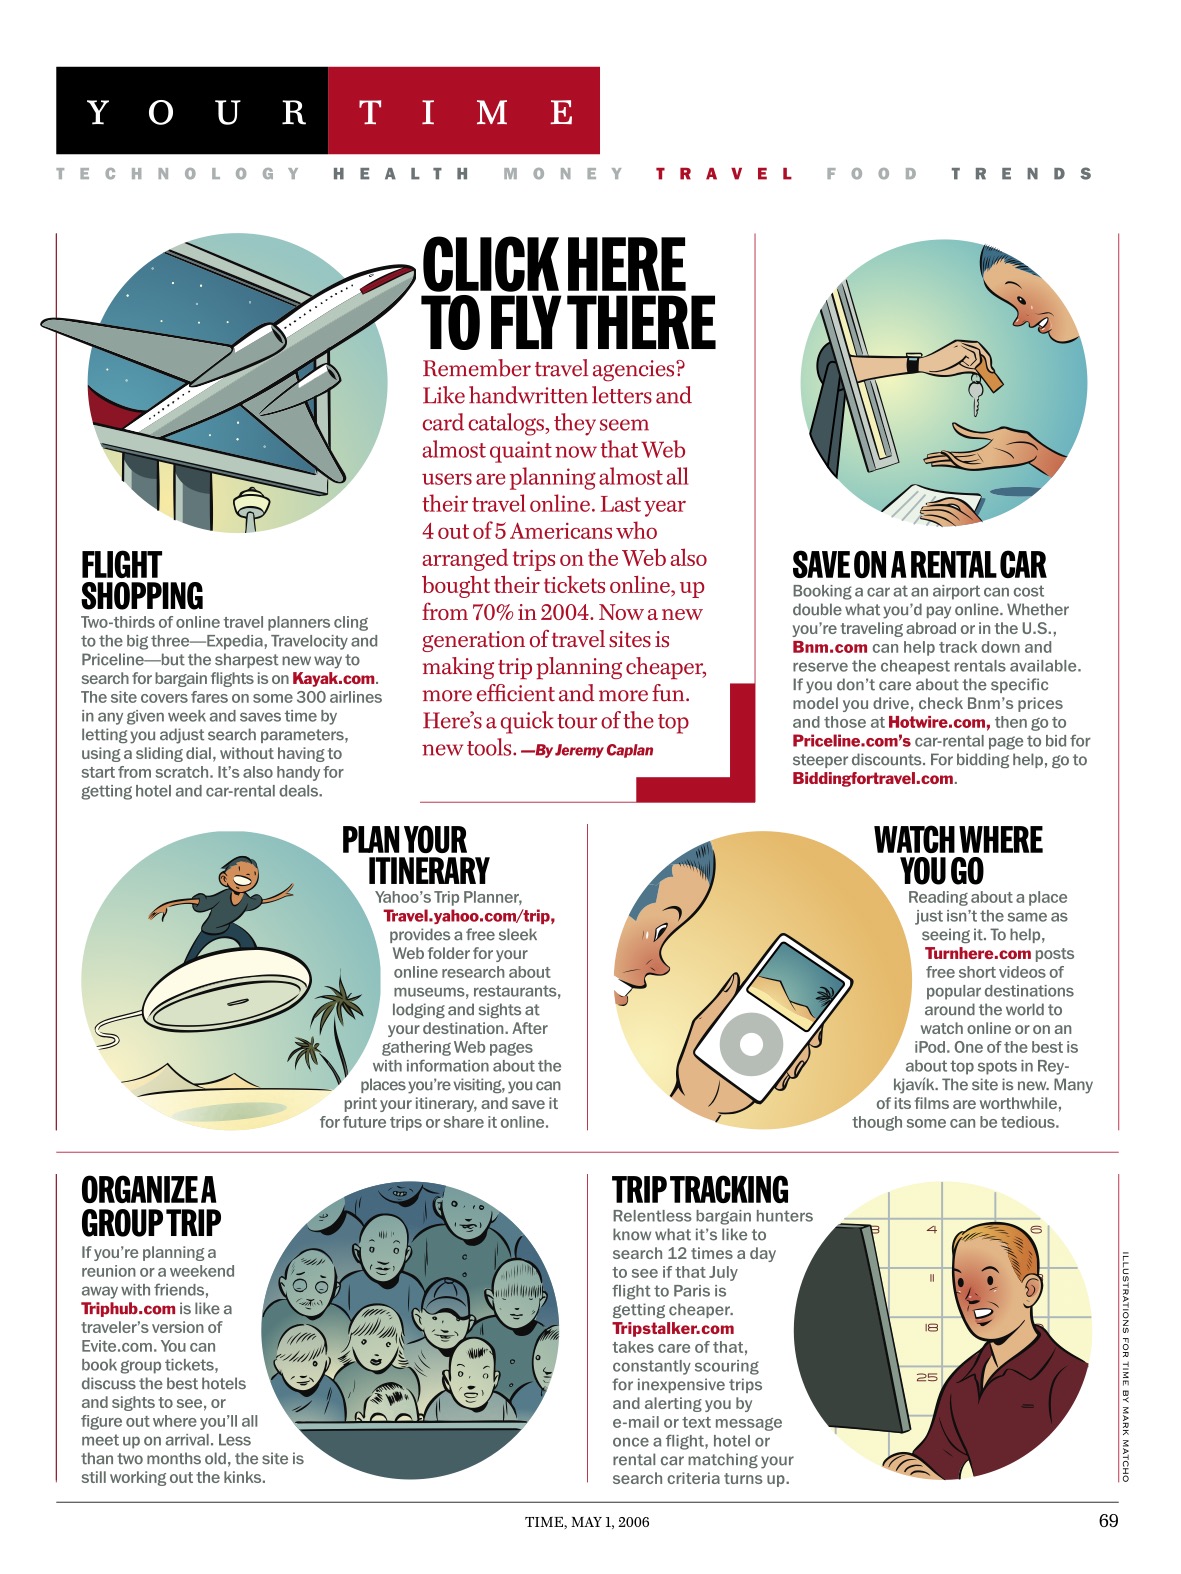
After writing for Time for Kids I worked at Time Magazine where I contributed articles about Google, Apple and Yahoo. In addition to tech and business topics, I wrote about trends ranging from carrotmobs and cereal cafes to mini-lit and life-hacking. Here are more of my Time Magazine stories.
I was a Ford Fellow in Entrepreneurial Journalism at the Poynter Institute, a Wiegers Fellow at Columbia Business School, where I completed my MBA, and a Knight-Bagehot Fellow at the Columbia Journalism School, where I earned an M.S. in Journalism. I live in New York City with my wife and two daughters. Here are some of my favorite authors and podcasts. Here's my YouTube channel. And I have a new newsletter you can sign up for here.
I grew up in Boston with a violin in one hand and a catcher's mitt on the other. I was an admirer of both Heifetz and the Chicago Cubs. During my time at Princeton I served during the winter as concertmaster for the International Symphony Orchestra in Jerusalem. I moved to New York to work for The Paris Review, Yahoo! Internet Life, and then Newsweek.
After writing for Time for Kids I worked at Time Magazine where I contributed articles about Google, Apple and Yahoo. In addition to tech and business topics, I wrote about trends ranging from carrotmobs and cereal cafes to mini-lit and life-hacking. Here are more of my Time Magazine stories.
I was a Ford Fellow in Entrepreneurial Journalism at the Poynter Institute, a Wiegers Fellow at Columbia Business School, where I completed my MBA, and a Knight-Bagehot Fellow at the Columbia Journalism School, where I earned an M.S. in Journalism. I live in New York City with my wife and two daughters. Here are some of my favorite authors and podcasts. Here's my YouTube channel. And I have a new newsletter you can sign up for here.
Time Magazine Articles


Watch a glimpse of my teaching life:


Some of my Medium posts
Open Office Hours
I host regular open office hours.
Feel free to book a 15-minute spot to touch base.
Feel free to book a 15-minute spot to touch base.
Contact Me
Let me know how I can be of help or sign up for my newsletter
